Overview
- Geological mapping — the systematic recording of rock types, structures, and geological relationships on maps — is one of the oldest and most fundamental practices in the earth sciences, dating from William Smith's pioneering 1815 geological map of England and Wales, the first map to show the distribution of rock formations across an entire country.
- Modern geological mapping integrates traditional field methods (traverse mapping, outcrop recording, structural measurements with compass and clinometer) with remote sensing technologies (satellite imagery from Landsat and ASTER, airborne geophysics, LiDAR) and geographic information systems (GIS), producing digital databases that serve resource exploration, hazard assessment, and land-use planning.
- National geological surveys — from the British Geological Survey founded in 1835 to over 150 such organizations operating worldwide today — produce and maintain geological maps as essential public infrastructure, supporting decisions about groundwater supply, mineral and energy resources, earthquake and landslide hazards, waste disposal, and construction site assessment.
Geological mapping is the practice of recording the distribution and relationships of rock types, geological structures, and earth materials on a map. It is one of the most fundamental activities in the earth sciences — the spatial expression of geology without which mineral exploration, groundwater management, hazard assessment, and land-use planning would operate blind. A geological map conveys information that no other document can: the type and age of rocks at the surface, the orientation and geometry of faults and folds, the boundaries between formations, and by extension the three-dimensional structure and history of the ground beneath our feet. From William Smith's groundbreaking 1815 map of England and Wales to the satellite-guided digital mapping of the twenty-first century, the geological map has remained the indispensable tool of the geologist.1, 5
History of geological mapping
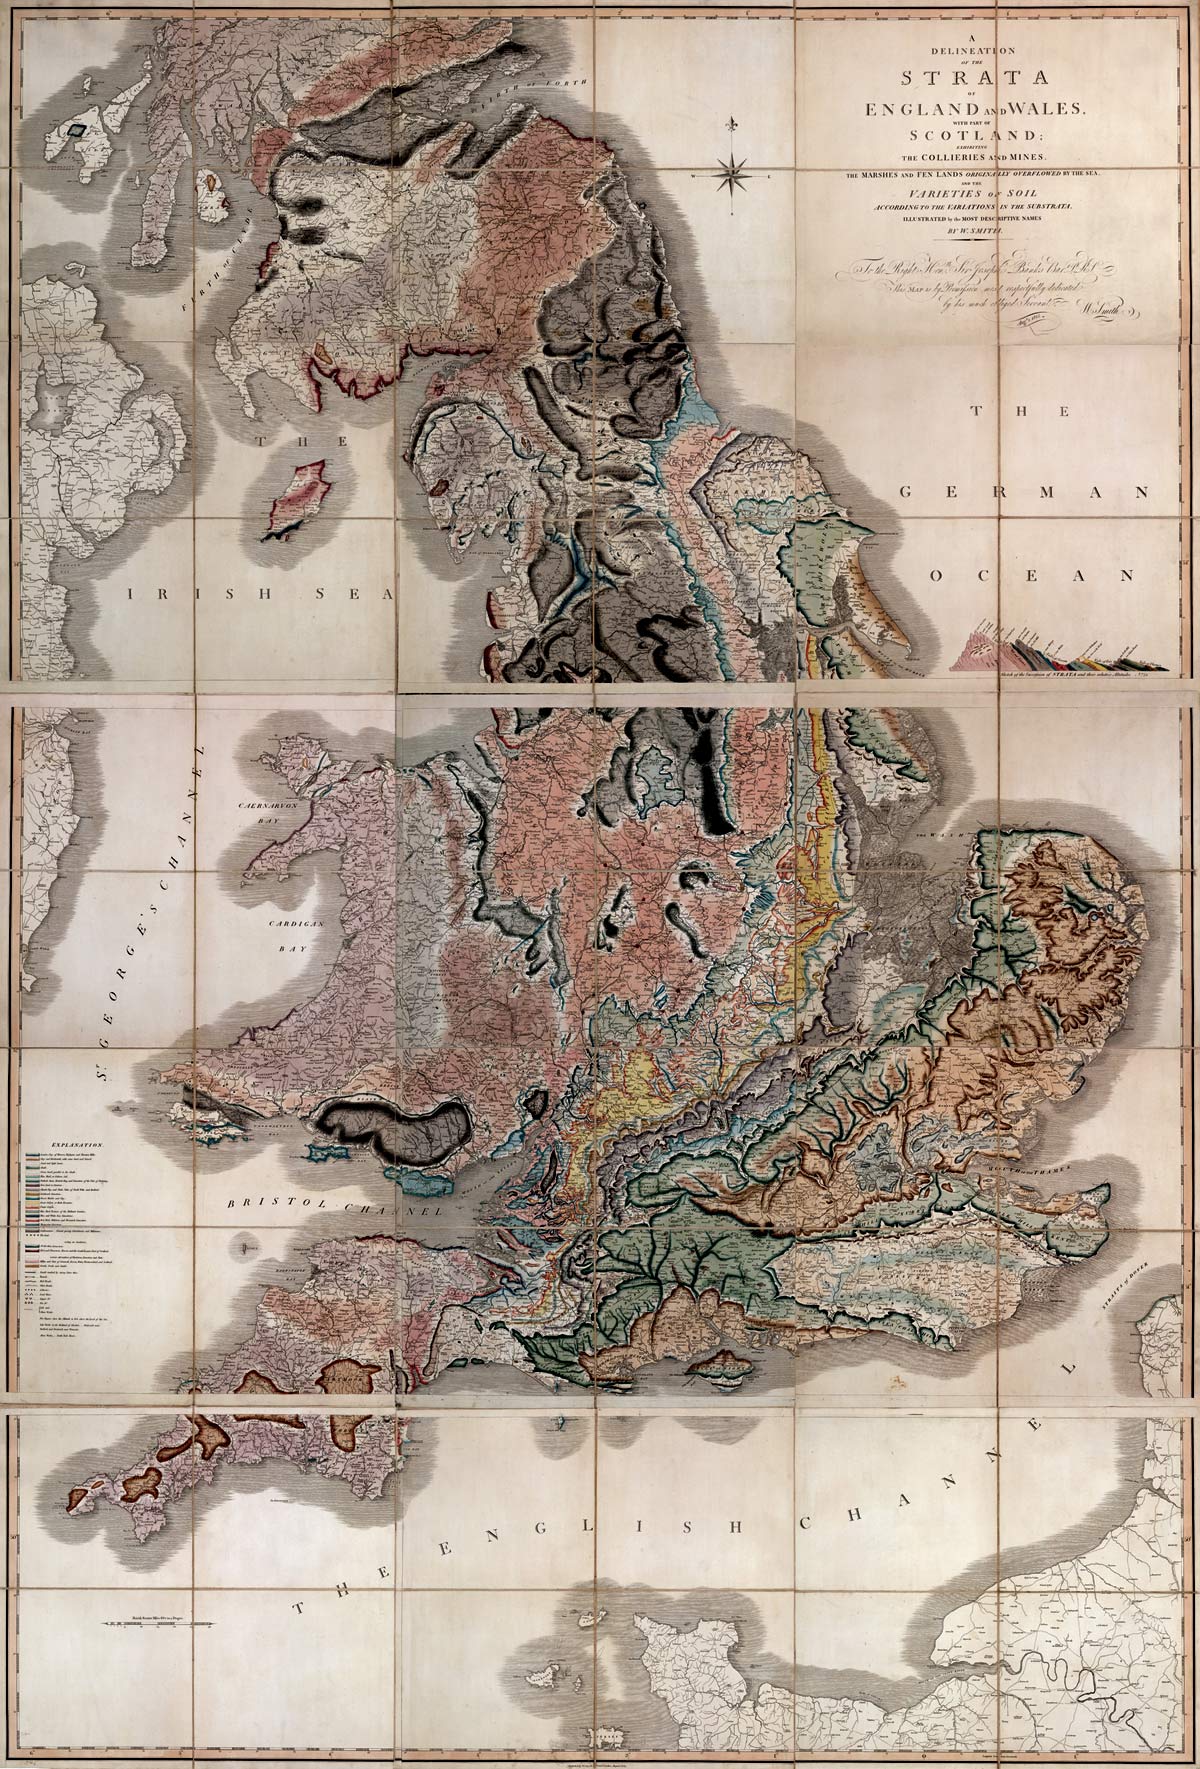
The concept of a geological map — a map showing the distribution of different rock types across the landscape — emerged at the end of the eighteenth century, when mineralogists and engineers began to recognize that rock formations occur in a regular, predictable order. The Frenchman Jean-Étienne Guettard produced mineral maps of France as early as 1746, but these were inventories of mineral localities rather than depictions of rock formations. The decisive step was taken by the English canal surveyor William Smith, who through decades of field observation across England and Wales recognized that each stratum could be identified not only by its lithology but by its characteristic fossils, and that the strata always occurred in the same superimposed order regardless of location.1, 2
Smith's great map, titled A Delineation of the Strata of England and Wales, with part of Scotland, was published on 1 August 1815. Measuring approximately 1.8 by 2.6 metres and hand-coloured, it depicted the distribution of more than twenty rock formations across the entirety of England and Wales, from the oldest rocks in the northwest to the youngest chalk and clay of the southeast. Smith used a brilliant cartographic innovation: he applied the strongest colour to the base of each formation where it cropped out and faded the colour upward toward the top, visually suggesting the three-dimensional dip of the strata beneath the surface. The map was both a scientific revolution — the first demonstration that geology could be systematically mapped across a large area — and a practical tool for engineers, miners, and landowners.1, 2
Smith's map inspired a rapid proliferation of geological mapping across Europe and North America. Georges Cuvier and Alexandre Brongniart published a geological map of the Paris Basin in 1811, and Leopold von Buch mapped parts of Germany and Scandinavia. The establishment of national geological surveys — the British Geological Survey (originally the Ordnance Geological Survey) in 1835, the Geological Survey of India in 1851, and the United States Geological Survey in 1879 — institutionalized geological mapping as a public responsibility, and these organizations have produced systematic geological maps of their territories ever since.5, 11
Field methods
Traditional geological mapping is a field-based discipline in which the geologist walks the terrain, examines outcrops, collects samples, measures structural attitudes, and records observations on a topographic base map. The fundamental field technique is traverse mapping, in which the geologist follows planned routes (traverses) across the study area, spaced closely enough to encounter every significant formation boundary and structural feature. At each outcrop, the geologist records the rock type, grain size, colour, mineralogy, sedimentary or igneous structures, fossil content, degree of weathering, and any deformational features such as cleavage, foliation, or joints.3, 4
The orientation of planar geological features — bedding planes, faults, joints, foliation — is measured with a geological compass and clinometer (or a combined instrument called a Brunton compass) and expressed as strike and dip. The strike is the direction of a horizontal line on the inclined plane, and the dip is the angle of maximum inclination from horizontal, measured perpendicular to the strike. For linear features such as fold axes, slickenlines, or mineral elongation lineations, the equivalent measurement is trend and plunge. These measurements are plotted on the map as standardized symbols — short lines with tick marks indicating dip direction and angle — enabling the reader to visualize the three-dimensional geometry of the geology from a two-dimensional representation.3, 4
Geological boundaries — the contacts between formations — are drawn by tracing the intersection of the formation with the topographic surface. Where outcrop is continuous, this is straightforward; where outcrop is absent or concealed by soil, vegetation, or glacial cover, the geologist infers the contact position from topographic expression, float (loose rock fragments derived from nearby outcrops), soil colour, vegetation changes, and geophysical data. The distinction between observed and inferred boundaries is indicated on the map by solid versus dashed lines, a convention that communicates the mapper's level of confidence.4
Map elements and conventions
A completed geological map communicates its information through a standardized set of elements. The map face shows the distribution of rock units, distinguished by colour or pattern, with the boundaries (contacts) between them drawn as lines whose character (solid, dashed, dotted) indicates whether the contact is exposed, inferred, or gradational. Faults are depicted as heavy lines, often with symbols indicating fault type (normal, reverse, thrust, strike-slip) and the direction of displacement. Fold axes are drawn as lines with arrows or symbols indicating whether the fold is an anticline (strata dipping away from the axis) or a syncline (strata dipping toward the axis).3, 4
The legend (or key) lists all mapped rock units in stratigraphic order — youngest at the top, oldest at the bottom — with their colours, patterns, names, and ages. This ordering mirrors the principle of superposition and enables the reader to understand the temporal relationships between units at a glance. The legend may also include symbols for structural features, sample locations, mineral occurrences, and other point data.4
Most geological maps are accompanied by one or more cross-sections — vertical slices through the geology along a chosen line — that illustrate the subsurface structure inferred from the surface geology and structural measurements. Cross-sections are essential for communicating the three-dimensional interpretation that the surface map alone cannot convey, showing the depth and geometry of formations, the displacement on faults, and the shape of folds. A stratigraphic column may also accompany the map, presenting the vertical sequence of formations with their thicknesses, lithologies, and age assignments in a single diagram.3, 4
Remote sensing and satellite imagery
The advent of Earth-observation satellites in the 1970s transformed geological mapping by providing synoptic views of large areas in multiple spectral bands, many of which reveal geological information invisible to the human eye. The Landsat programme, initiated with the launch of Landsat 1 in 1972, has provided continuous global coverage at spatial resolutions of 15 to 80 metres across visible, near-infrared, and shortwave infrared wavelengths. Different rock types and minerals have characteristic spectral signatures — iron oxides absorb strongly in certain visible wavelengths, clays and carbonates in specific shortwave infrared bands — allowing lithological discrimination from orbital data.8
The Advanced Spaceborne Thermal Emission and Reflection Radiometer (ASTER), launched aboard NASA's Terra satellite in 1999, added thermal infrared bands particularly suited to mapping silicate minerals and distinguishing quartz-rich from feldspar-rich rocks. ASTER's 14 spectral bands spanning the visible through thermal infrared have been used extensively for mineral exploration, particularly in arid regions where sparse vegetation exposes the bedrock surface.7 Multispectral and hyperspectral satellite data are now routinely integrated with field observations in geological mapping programmes worldwide, accelerating reconnaissance mapping and guiding field traverses to areas of maximum geological interest.
Airborne remote sensing adds further capabilities. LiDAR (Light Detection and Ranging) uses pulsed laser light to map topography at centimetre-scale resolution, even beneath forest canopy. Bare-earth LiDAR digital elevation models reveal subtle topographic features — fault scarps, landslide headscarps, moraine ridges, bedrock lineaments — that are invisible on the ground or in conventional aerial photographs. LiDAR has become an indispensable tool for mapping geological hazards and refining formation contacts in areas of dense vegetation.13 Airborne geophysical surveys — including magnetic, gravity, radiometric, and electromagnetic methods — measure the physical properties of rocks and can delineate buried geological boundaries, intrusions, and fault zones to depths of hundreds of metres or more, providing essential subsurface information where outcrop is lacking.12
GIS integration and digital mapping
Geographic information systems (GIS) have revolutionized the production, storage, analysis, and dissemination of geological maps since the 1990s. A geological map in a GIS is not a static image but a spatial database in which every polygon (formation), line (contact, fault), and point (structural measurement, sample location) carries attribute data that can be queried, analysed, and combined with other datasets. This enables operations impossible with paper maps: overlay analysis with topography, hydrology, or land-use data; three-dimensional visualization; statistical analysis of structural measurements; and the rapid production of derivative maps for specific purposes such as mineral potential, groundwater vulnerability, or seismic hazard.9, 15
Digital field data capture — using tablet computers or ruggedized laptops equipped with GPS, digital compass, and camera — has replaced much of the traditional notebook-and-paper workflow. The geologist records observations directly into a GIS database in the field, georeferenced to centimetre accuracy, and the data are immediately available for analysis and map compilation. This workflow reduces transcription errors, speeds map production, and ensures that the primary field data are preserved in a structured, searchable format rather than locked in handwritten notebooks.15
The shift to digital geological mapping has also enabled the construction of three-dimensional geological models that extend the map downward into the subsurface. By combining surface geological data with borehole logs, seismic reflection profiles, and geophysical surveys, geologists can build volumetric models of the subsurface that depict the geometry of formations, faults, and intrusions in three dimensions. These models are essential tools in mining geology, petroleum exploration, geotechnical engineering, and groundwater resource assessment.14
Subsurface mapping
While surface geological mapping records the geology exposed at the ground surface, many applications require knowledge of the geology at depth. Subsurface geological mapping draws on data from boreholes (wells), mines, geophysical surveys, and seismic reflection profiling to extend the geological map into the third dimension.10
Seismic reflection profiling is the most powerful tool for imaging subsurface geological structure. The method involves generating seismic waves at the surface (using explosives, vibrating trucks, or air guns at sea) and recording the echoes reflected from geological boundaries at depth. The resulting seismic profiles resemble geological cross-sections, revealing the geometry of sedimentary layers, faults, folds, unconformities, and intrusions to depths of tens of kilometres. Seismic data are the foundation of petroleum exploration geology and have also been used to map crustal structure, image subduction zones, and study the deep architecture of sedimentary basins.10
Borehole data provide direct samples of subsurface rock — either as drill cuttings or as continuous cylindrical cores — and are the only means of confirming the lithological and stratigraphic interpretations made from seismic or other geophysical data. Well logs, which measure the physical properties of rocks in situ (gamma-ray emission, electrical resistivity, density, sonic velocity), are used to correlate formations between wells and to construct subsurface geological maps showing the depth, thickness, and lateral extent of formations. In mature petroleum basins, thousands of wells may be available, allowing detailed subsurface mapping with confidence comparable to surface mapping.10, 14
Applications
Geological maps serve an extraordinary range of practical applications beyond their scientific value. Resource exploration — for minerals, petroleum, groundwater, and construction materials — is the oldest and most direct application. Geological maps show the locations and extents of potentially ore-bearing formations, petroleum source and reservoir rocks, aquifer units, and aggregate deposits, guiding exploration programmes and reducing the cost and risk of discovery.9
Hazard assessment depends critically on geological mapping. Earthquake hazard maps are built on geological maps that show the locations and characteristics of active faults, the distribution of soil and rock types that control ground shaking amplification, and the areas susceptible to liquefaction. Landslide susceptibility maps combine geological data (rock type, structure, slope angle) with hydrological and meteorological information to identify areas at risk. Volcanic hazard maps delineate the distributions of lavas, pyroclastic flows, lahars, and ashfall deposits from past eruptions to forecast the likely impact areas of future events.3, 13
Land-use planning benefits from geological maps in ways that are often invisible to the public but profoundly important. Construction site assessment relies on knowing the subsurface geology — whether the ground is solid bedrock, compressible clay, or unstable fill — to determine foundation requirements and avoid geotechnical failures. Waste disposal siting requires geological information to ensure that landfills and repositories are located in settings where groundwater contamination is unlikely. Agricultural soil surveys are grounded in the underlying geology that determines soil parent material, drainage characteristics, and nutrient content.9, 15
National geological surveys
The systematic production of geological maps is the primary responsibility of national geological surveys, government agencies established specifically for this purpose. The British Geological Survey (BGS), founded in 1835 under the direction of Henry De la Beche, was the first national geological survey in the world. Its initial mandate — to produce a complete geological map of the United Kingdom — has expanded over nearly two centuries to encompass marine geology, hydrogeology, geochemistry, geophysics, and environmental geology, but mapping remains at its core.11
The United States Geological Survey (USGS), established by Congress in 1879, has produced geological maps at scales from 1:24,000 to 1:2,500,000 covering the entire United States. The USGS National Geologic Map Database serves as the digital repository for geological map data from both the USGS and state geological surveys, making geological information freely accessible to researchers, planners, and the public. Similar organizations exist in virtually every country with a functioning scientific infrastructure — from the Geological Survey of India (founded 1851) to the Bureau de Recherches Géologiques et Minières (BRGM) in France, the Geological Survey of Japan, and their counterparts across Africa, Asia, and South America.5, 15
Despite the long history of geological mapping, large areas of the Earth's land surface remain incompletely mapped at useful scales. In developed countries, most areas have been mapped at 1:50,000 or better, but in many developing nations, geological mapping may exist only at reconnaissance scales of 1:250,000 or 1:1,000,000, insufficient for site-specific applications. The One Geology initiative, launched in 2007, is an international effort to compile and harmonize geological map data from all participating countries into a seamless global geological map — a twenty-first-century realization of William Smith's original ambition, now extended to the entire planet.15