Overview
- Tsunamis are long-period gravity waves generated primarily by submarine earthquakes at subduction zone megathrusts, but also by volcanic eruptions, submarine landslides, and asteroid impacts, propagating across entire ocean basins at speeds exceeding 700 kilometres per hour before amplifying catastrophically in shallow coastal waters.
- The 2004 Indian Ocean tsunami and the 2011 Tohoku tsunami together killed more than 250,000 people and fundamentally transformed tsunami science, prompting the global expansion of deep-ocean detection networks, real-time forecasting models, and the systematic study of paleotsunami deposits to extend hazard records beyond the instrumental era.
- Geological evidence from paleotsunami sand sheets, boulder deposits, and coastal subsidence records demonstrates that great tsunamis have recurred at subduction zones on timescales of centuries to millennia, providing critical constraints on the recurrence intervals used in probabilistic hazard assessments for vulnerable coastlines worldwide.
A tsunami is a series of long-period ocean waves generated by a sudden, large-scale displacement of the water column, most commonly caused by a submarine earthquake at a subduction zone megathrust. Unlike wind-driven ocean waves, which are confined to the sea surface, tsunamis involve the motion of the entire water column from the seafloor to the surface, giving them wavelengths of tens to hundreds of kilometres and periods of ten minutes to over an hour.4, 15 In the deep ocean, a tsunami may be only a few tens of centimetres high, passing beneath ships unnoticed, yet it travels at speeds exceeding 700 kilometres per hour. When the wave enters shallow coastal waters, its energy is compressed and its height amplifies dramatically, sometimes producing walls of water more than 30 metres tall that inundate coastlines with devastating force.4
The word "tsunami" derives from the Japanese characters for harbour (tsu) and wave (nami), reflecting the long historical experience of Japanese coastal communities with these events. Although tsunamis have been recorded for millennia, the scientific study of their physics, generation mechanisms, and geological signatures has advanced most rapidly since the catastrophic 2004 Indian Ocean tsunami, which killed approximately 230,000 people across fourteen countries and exposed critical gaps in warning systems and hazard preparedness.1, 7 The subsequent 2011 Tohoku tsunami in Japan further transformed the field, demonstrating that even the most seismically monitored nation on Earth could be overwhelmed by a tsunami that exceeded all historical precedent.2, 3
Generation mechanisms
Tsunamis can be generated by any process that rapidly displaces a large volume of ocean water. The most common and destructive source is the sudden vertical displacement of the seafloor during a submarine earthquake, but volcanic eruptions, submarine and subaerial landslides, and asteroid impacts have all generated significant tsunamis in the geological record.12, 14, 15
Submarine earthquakes are responsible for the vast majority of destructive tsunamis. When a megathrust fault at a subduction zone ruptures, the overriding plate, which has been dragged downward and compressed by the locked fault during the interseismic period, snaps upward, vertically displacing the overlying water column by metres to tens of metres over an area that can span hundreds of kilometres. The efficiency of tsunami generation depends critically on the fault geometry: shallow-dipping thrust faults that produce substantial vertical seafloor displacement are far more tsunamigenic than strike-slip faults, which primarily produce horizontal motion.1, 2 The 2004 Sumatra-Andaman earthquake ruptured approximately 1,300 kilometres of the subduction interface, displacing the seafloor vertically by up to 15 metres and generating one of the most powerful tsunamis in recorded history.1
Volcanic tsunamis can be generated through several distinct mechanisms: the collapse of a volcanic edifice into the sea, pyroclastic flows entering the water, submarine explosions, and caldera collapse. The 1883 eruption of Krakatau generated tsunamis exceeding 30 metres that killed more than 36,000 people along the coasts of Java and Sumatra. More recently, the January 2022 eruption of Hunga Tonga-Hunga Ha'apai in the Kingdom of Tonga produced a tsunami that propagated across the Pacific, demonstrating that volcanic sources can generate trans-oceanic tsunamis comparable to those from great earthquakes.12
Submarine and subaerial landslides displace water by the rapid movement of large volumes of rock, sediment, or volcanic debris into or within the ocean. Landslide-generated tsunamis tend to have shorter wavelengths and attenuate more rapidly with distance than earthquake-generated tsunamis, but they can produce extremely high local wave amplitudes. The 1958 Lituya Bay event in Alaska, in which a rockslide triggered by an earthquake entered a narrow fjord, produced a wave that ran up to an elevation of 524 metres on the opposite shore, the highest wave runup ever recorded.10
Asteroid impacts in the ocean represent the rarest but potentially most energetic tsunami source. Numerical modelling of the Chicxulub impact 66 million years ago, which struck the shallow Yucatan shelf, indicates that the resulting tsunami was approximately 30,000 times more energetic than the 2004 Indian Ocean tsunami, with initial wave heights of hundreds of metres in the Gulf of Mexico and flow velocities sufficient to scour the seafloor thousands of kilometres from the impact site.11 Probabilistic hazard assessments suggest that asteroid impacts capable of generating destructive tsunamis, while extremely rare on human timescales, represent a non-negligible component of the long-term tsunami hazard budget for oceanic coastlines.14
Wave physics and propagation
The physics of tsunami propagation is governed by the shallow-water wave equations, a simplification of the full Navier-Stokes equations that is valid when the wavelength of the wave is much greater than the water depth. For tsunamis, whose wavelengths typically range from 100 to 500 kilometres, this condition is satisfied across the entire ocean, including the deepest trenches.4, 15 The phase velocity of a shallow-water wave is given by the expression c = √(gH), where g is the gravitational acceleration (9.81 m/s2) and H is the water depth. In the deep Pacific, where the average depth is approximately 4,000 metres, a tsunami propagates at roughly 200 metres per second, or about 720 kilometres per hour, comparable to the cruising speed of a commercial jet aircraft.4
A critical property of tsunamis in the deep ocean is that their amplitude is extremely small relative to their wavelength. A tsunami with a wavelength of 200 kilometres and an amplitude of 50 centimetres represents a wave steepness of only 2.5 parts per billion, making it essentially invisible to ships at sea and detectable in the deep ocean only by sensitive bottom-pressure sensors. The energy of the wave is distributed over the full depth of the water column, so the energy density per unit volume is very low in deep water.4, 7
As a tsunami approaches the coast and the water depth decreases, several processes transform its character. Shoaling occurs as the decreasing depth forces the wave energy into a progressively smaller cross-section of water, causing the wave height to increase while the wavelength decreases and the wave speed drops. The relationship between deep-water and shallow-water wave heights is described by Green's law, which predicts that wave amplitude varies as the inverse fourth root of the water depth. Thus a wave that is 0.5 metres high in water 4,000 metres deep will amplify to approximately 2.5 metres in water 10 metres deep, and local bathymetric focusing and resonance effects can increase the height far beyond this estimate.4, 15
Wave refraction bends the tsunami wavefront as different parts of the wave travel over regions of different depth, concentrating energy on headlands and submarine ridges while dispersing it across embayments. Resonance in harbours, bays, and continental shelves can further amplify the wave, as the natural oscillation period of a bay may coincide with the period of the incoming tsunami, producing standing waves with greatly enhanced amplitudes. These effects explain why tsunami damage is often highly variable along a coastline, with adjacent communities experiencing dramatically different wave heights from the same event.4, 13
Tsunami wave speed versus ocean depth4
Runup and inundation
When a tsunami reaches the shore, the final stage of its transformation produces the most destructive effects. Runup is defined as the maximum vertical elevation above sea level to which the water reaches on land, while inundation refers to the horizontal distance that the water penetrates inland from the normal shoreline. The behaviour of the tsunami at the coast depends on the nearshore bathymetry, the coastal topography, the wave period and amplitude, and whether the wave arrives as a gradually rising flood or as a turbulent bore.3, 4
On gently sloping coastlines with wide continental shelves, tsunamis typically arrive as a rapid rise in water level resembling an extremely fast tide, flooding low-lying areas for tens of minutes before receding. On steeper coastlines or where the wave has been amplified by nearshore focusing, the tsunami may break and arrive as a turbulent bore, a nearly vertical wall of water advancing inland at speeds of 5 to 10 metres per second with tremendous destructive power.4 The 2004 Indian Ocean tsunami exhibited both behaviours: on the low-lying coasts of Sri Lanka and Thailand, it arrived as a rapidly rising surge, while in Banda Aceh, Sumatra, it formed a turbulent bore exceeding 30 metres in height that penetrated several kilometres inland, stripping the landscape to bedrock in many areas.1
The receding phase of a tsunami, often called the backwash or drawdown, can be nearly as destructive as the incoming wave. The enormous volume of water that flooded inland must return to the sea, and the resulting seaward flow carries debris, sediment, and victims back offshore. In many tsunamis, the first visible sign of the approaching wave is not a wall of water but rather a sudden withdrawal of the sea, exposing the seafloor for hundreds of metres or more as the trough of the leading wave arrives before the crest. This phenomenon, while providing a brief natural warning to observant coastal residents, also draws curious onlookers onto the exposed seafloor, contributing to the death toll.15
Numerical models of tsunami runup, such as the MOST (Method of Splitting Tsunami) code developed at NOAA's Pacific Marine Environmental Laboratory, solve the nonlinear shallow-water equations over high-resolution coastal topographic and bathymetric grids to produce inundation forecasts. Validation of these models against field survey data from the 2004 and 2011 tsunamis has demonstrated that they can reproduce observed runup heights and inundation extents with useful accuracy when the earthquake source parameters are well constrained.4, 7
The 2004 Indian Ocean tsunami
The earthquake that struck off the northwest coast of Sumatra at 00:58:53 UTC on 26 December 2004 was the third-largest instrumentally recorded earthquake in history, with a moment magnitude of 9.1. The rupture initiated at a depth of approximately 30 kilometres on the subduction interface between the Indo-Australian Plate and the overriding Sunda Plate, then propagated northward along approximately 1,300 kilometres of the fault at a velocity of roughly 2.5 kilometres per second, with the entire rupture lasting approximately ten minutes.1 Peak fault slip of approximately 15 metres occurred near Banda Aceh in northern Sumatra, and the resulting vertical displacement of the seafloor generated a tsunami that radiated outward across the Indian Ocean.
Within 20 minutes of the earthquake, waves exceeding 30 metres struck the coast of Banda Aceh, obliterating entire coastal communities and penetrating up to 4 kilometres inland. Over the following hours, the tsunami crossed the Indian Ocean at speeds of roughly 700 kilometres per hour, reaching Sri Lanka and the east coast of India (approximately 1,500 kilometres away) within about two hours, the east coast of Africa within seven hours, and even producing measurable signals in the Atlantic and Pacific Oceans.1 The death toll exceeded 230,000, with Indonesia, Sri Lanka, India, and Thailand suffering the greatest losses.
The 2004 disaster exposed a critical gap in the global tsunami warning infrastructure. At the time of the earthquake, no tsunami warning system existed in the Indian Ocean. The Pacific Tsunami Warning Center (PTWC) in Hawaii detected the earthquake within minutes and recognized its tsunamigenic potential, but lacked the communication channels and protocols to issue timely warnings to Indian Ocean nations, most of which had never experienced a significant tsunami in living memory.7 In the aftermath, the international community rapidly established the Indian Ocean Tsunami Warning and Mitigation System (IOTWS), deploying seismometers, tide gauges, and deep-ocean pressure sensors throughout the Indian Ocean basin and creating national tsunami warning centres in each of the riparian nations.7, 15
The 2011 Tohoku tsunami
On 11 March 2011, a moment magnitude 9.1 earthquake ruptured approximately 500 kilometres of the Japan Trench megathrust off the Pacific coast of northeastern Honshu. The earthquake was remarkable for the magnitude of fault slip in the shallow portion of the subduction zone, where geodetic and seismic inversions indicated peak displacements of approximately 50 metres near the trench axis, far exceeding the slip observed in any previous subduction earthquake.2 This enormous seafloor displacement generated a tsunami of extraordinary destructive power.
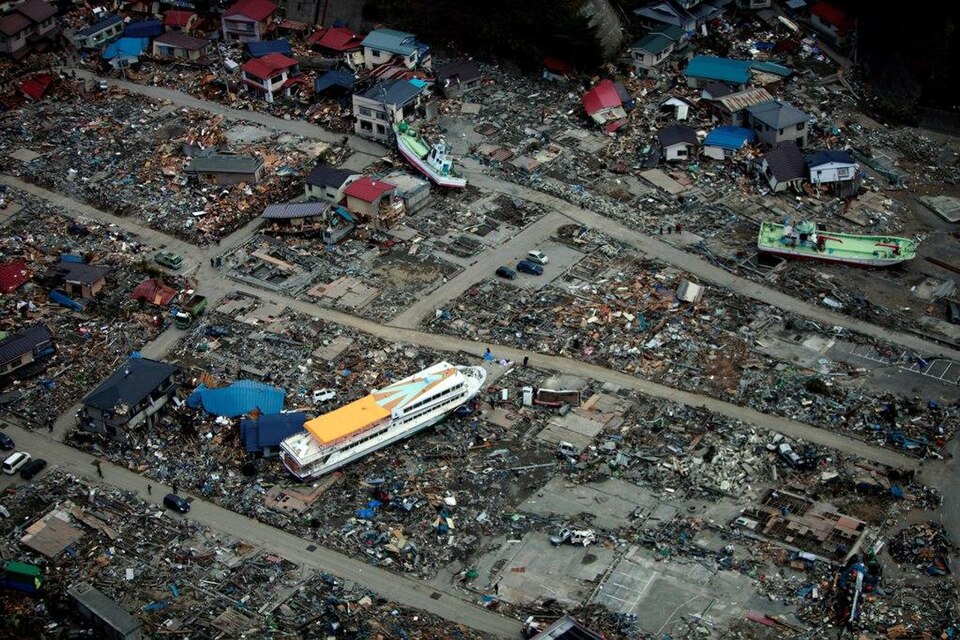
A comprehensive post-event field survey conducted by Japanese researchers measured tsunami traces at more than 5,300 locations along the coast, generating the largest tsunami survey dataset ever compiled. The survey documented maximum runup heights exceeding 39 metres on the ria coast of the Sanriku region, where the narrow, funnel-shaped bays focused and amplified the incoming waves. On the broad, low-lying Sendai Plain to the south, the tsunami reached inundation heights of nearly 20 metres and penetrated more than 5 kilometres inland, overwhelming coastal defences that had been designed for smaller historical events.3
The tsunami triggered the Fukushima Daiichi nuclear disaster when waves approximately 14 metres high overtopped the plant's 5.7-metre seawall, flooding the emergency diesel generators and causing a station blackout that led to three reactor core meltdowns. This cascading failure underscored the critical importance of accurate tsunami hazard assessment for the siting and design of critical infrastructure.2, 3 Prior seismic hazard assessments for the Japan Trench had estimated a maximum credible earthquake of approximately magnitude 8.2 to 8.4, based on the historical catalogue extending back only a few centuries. The 2011 event demonstrated that instrumental and historical records alone are insufficient to characterize the full range of possible earthquakes and tsunamis at a subduction zone, motivating a worldwide reassessment of maximum magnitude estimates and increased investment in paleotsunami research.2
Paleotsunami deposits and the geological record
Geological evidence of past tsunamis, preserved in the sedimentary record as paleotsunami deposits, provides a means of extending the tsunami record far beyond the few centuries covered by historical documents and the even shorter span of instrumental observations. The systematic study of paleotsunami deposits began in the late 1980s when Brian Atwater described widespread sand sheets in the tidal marshes of coastal Washington State that he attributed to tsunamis generated by great earthquakes on the Cascadia subduction zone.5 This discovery was transformative: the Cascadia margin had been regarded by many geologists as aseismic because it had produced no significant earthquakes in the approximately 200-year written history of the Pacific Northwest. Atwater's recognition that the marshes contained repeated layers of tsunami-deposited sand, separated by intervals of marsh soil accumulation, demonstrated that the subduction zone had produced a series of great earthquakes over the Holocene, each separated by centuries of apparent quiescence.5
The most compelling confirmation of Atwater's hypothesis came from historical records in Japan. Kenji Satake and colleagues identified descriptions of a damaging "orphan tsunami" that struck the Pacific coast of Japan on 27 January 1700. By modelling the trans-Pacific propagation time and comparing the wave heights recorded in Japanese documents with the predictions of tsunami models for various earthquake scenarios on the Cascadia margin, Satake determined that the tsunami was generated by a great earthquake of approximately magnitude 9 on the Cascadia subduction zone at about 21:00 local time on 26 January 1700.6 Subsequent work refined the magnitude estimate and fault slip distribution using more detailed Japanese wave height observations, confirming a rupture length of approximately 1,000 kilometres with mean slip of roughly 14 metres.16 This remarkable forensic reconstruction linked the geological and historical records across the Pacific Ocean and established that the Cascadia subduction zone is capable of producing earthquakes and tsunamis comparable to the 2004 Indian Ocean event.
Paleotsunami deposits are typically identified by several diagnostic sedimentary characteristics. They are commonly composed of anomalous sheets of sand, deposited by the landward surge of the tsunami over otherwise muddy or peaty coastal environments such as tidal marshes, lagoons, and coastal lakes. The sand sheets thin and fine landward, away from the coast, reflecting the attenuation of the wave as it propagates inland. They may contain marine microfossils (diatoms, foraminifera) transported from offshore or nearshore environments into settings where they would not normally occur, and they often display a sharp, erosional base reflecting the scouring action of the incoming wave.8 However, distinguishing tsunami deposits from those left by storm surges remains one of the principal challenges in paleotsunami research, because many of the same sedimentary features can be produced by both processes.8
Beyond sand sheets, tsunamis can leave other geological signatures. Coastal boulder deposits, in which blocks weighing tonnes to hundreds of tonnes are transported onshore by wave action, have been attributed to tsunami inundation at sites in the Mediterranean, the Caribbean, and the Pacific. Coseismic subsidence of coastal wetlands, recorded as buried soils overlain by tidal mud, provides an independent record of the earthquakes that generated the tsunamis. The integration of these multiple lines of evidence, combined with radiocarbon dating and other geochronological techniques, has enabled researchers to reconstruct tsunami recurrence intervals spanning thousands of years at subduction zones in Cascadia, Japan, Chile, and New Zealand.5, 8, 13
Tsunami warning systems
Modern tsunami warning systems integrate three complementary technologies: seismic networks that detect and characterize tsunamigenic earthquakes within minutes, deep-ocean pressure sensors that detect the tsunami wave in the open ocean, and coastal tide gauges that confirm wave arrival and amplitude at the shoreline. The development of these systems has been driven by catastrophic events: the 1946 Aleutian tsunami, which killed 159 people in Hilo, Hawaii, led to the establishment of the Pacific Tsunami Warning Center in 1949; the 2004 Indian Ocean disaster motivated the expansion of warning coverage to all ocean basins; and the 2011 Tohoku event prompted further improvements in real-time forecasting capability.7
The most significant technological advance in tsunami detection has been the Deep-ocean Assessment and Reporting of Tsunamis (DART) system, developed by NOAA's Pacific Marine Environmental Laboratory beginning in the mid-1990s. Each DART station consists of a seafloor bottom-pressure recorder (BPR) anchored at depths of 1,000 to 6,000 metres and a companion surface buoy that relays data to shore via satellite. The BPRs are capable of detecting pressure changes corresponding to sea-surface elevation variations as small as 1 centimetre in 6,000 metres of water, enabling the detection of a tsunami wave in the deep ocean long before it reaches shore.7 As of 2024, a global network of more than 60 DART stations is deployed across the Pacific, Atlantic, Indian, and Caribbean basins, operated by the United States, Australia, Chile, India, Thailand, and other nations.7, 15
The value of the DART network lies not only in detection but in its integration with real-time tsunami forecasting models. When a DART station records the passage of a tsunami wave, the observed waveform is compared with a pre-computed database of model tsunami scenarios for the source region. The scenario that best matches the DART observations is selected and used to forecast wave amplitudes and arrival times at coastal communities, a process that can be completed within minutes of the wave's detection in the deep ocean. This forecast-on-demand approach has proven far more accurate than the older method of issuing warnings based solely on earthquake magnitude, which frequently overestimated or underestimated the tsunami threat and led to costly false alarms or, worse, failures to warn.7
Despite these advances, significant challenges remain. Near-field communities, those located within a few hundred kilometres of the earthquake source, may have only minutes of warning before the first wave arrives, making effective evacuation critically dependent on public education and pre-planned escape routes rather than on institutional warning systems. The 2011 Tohoku event demonstrated that even Japan's advanced seismic and tsunami detection networks could not provide adequate warning time for communities closest to the epicentre, many of whom had less than 30 minutes between the earthquake and the arrival of the first wave.2, 3, 7
Megatsunamis
The term megatsunami is applied informally to tsunami events that produce wave runup heights far exceeding those of typical seismogenic tsunamis, generally through mechanisms involving the rapid displacement of enormous volumes of water by landslides or volcanic collapses rather than by seafloor deformation during earthquakes. Megatsunamis are characteristically local phenomena, producing extreme wave heights near the source but attenuating rapidly with distance due to their relatively short wavelengths.10, 15
The most celebrated example is the 1958 Lituya Bay event in southeastern Alaska. On the evening of 9 July 1958, a magnitude 7.8 earthquake on the Fairweather Fault triggered a massive rockslide on the northeast wall of Gilbert Inlet at the head of Lituya Bay. Approximately 30 million cubic metres of rock plunged from an elevation of roughly 900 metres into the narrow inlet, generating an enormous impulse wave. The wave ran up the opposite slope of the inlet to a maximum elevation of 524 metres above sea level, stripping all vegetation and soil down to bedrock, leaving a trimline that is still clearly visible in aerial photographs decades later. Physical laboratory modelling at a 1:675 scale, conducted by Fritz and colleagues, reproduced the key features of the event and demonstrated that the rockslide impact generated an initial wave crest approximately 150 metres high at the point of entry that evolved into a solitary-like wave as it propagated down the bay.10
A far larger event, the Storegga Slide, occurred approximately 8,150 years ago on the continental margin of Norway. The slide involved the catastrophic failure of approximately 3,500 cubic kilometres of sediment on the Norwegian continental slope, making it one of the largest known submarine landslides in the geological record. The resulting tsunami inundated coastlines around the Norwegian Sea and North Sea, depositing sand sheets that have been documented at elevations of 10 to 12 metres above contemporaneous sea level in western Norway, 3 to 6 metres in northeastern Scotland, and above 20 metres on the Shetland Islands.9 Numerical simulations of the Storegga tsunami, validated against the field observations of deposit elevation and distribution, indicate initial wave heights of 10 to 15 metres along the Norwegian coast, diminishing to 3 to 5 metres along the Scottish coast, approximately four to six hours after the slide.9 The event occurred during the Mesolithic period, when human communities occupied the coastal lowlands of the North Sea basin, and it may have contributed to the final drowning of Doggerland, the landmass that connected Britain to continental Europe before postglacial sea-level rise submerged it.
On geological timescales, the most energetic tsunamis are those generated by large asteroid impacts in the ocean. The Chicxulub impact 66 million years ago, which struck the shallow shelf of the Yucatan Peninsula and triggered the Cretaceous-Paleogene mass extinction, produced a tsunami of almost inconceivable power. Global simulations indicate that the initial wave in the Gulf of Mexico was hundreds of metres high, and the resulting tsunami propagated into all major ocean basins, producing seafloor flow velocities exceeding 20 centimetres per second at distances greater than 10,000 kilometres from the impact site, sufficient to erode and rework deep-sea sediments across much of the global ocean floor.11 Geological evidence supporting these simulations includes erosional unconformities, displaced sediment, and ripple marks in Cretaceous-Paleogene boundary sections at sites far from the impact, consistent with the passage of a powerful deep-ocean current generated by the impact tsunami.11
Subduction zone recurrence intervals
A central question in tsunami hazard assessment is how frequently great tsunamigenic earthquakes recur at a given subduction zone. The answer determines the probability that a destructive tsunami will strike a particular coast within a given time period, and it underpins the engineering design of coastal defences, the siting of critical infrastructure, and the formulation of evacuation plans. Because the instrumental record of seismology spans only about 120 years and the historical record rarely extends beyond a few centuries, the recurrence intervals of great subduction earthquakes must be estimated primarily from geological evidence.5, 13
At the Cascadia subduction zone, paleotsunami deposits and records of coseismic coastal subsidence in tidal marshes from British Columbia to northern California have identified at least 19 great earthquakes over the past 10,000 years, yielding an average recurrence interval of approximately 500 years, with individual intervals ranging from roughly 200 to more than 800 years.5, 6 The most recent event, the magnitude ~9 earthquake of 26 January 1700, occurred more than 320 years ago, placing the Cascadia margin within the window of time during which a future great earthquake is considered likely.6, 16
Along the Japan Trench, paleotsunami research conducted after the 2011 event identified geological evidence for a predecessor tsunami of similar scale approximately 1,000 years earlier, during the Jogan earthquake of AD 869, which historical chronicles describe as having inundated the Sendai Plain. The geological record thus revealed what the instrumental and modern historical records had concealed: that magnitude 9 events on the Japan Trench recur on a millennial timescale, a finding that arrived tragically too late to inform the hazard assessments that had been used to design the Fukushima Daiichi seawall and the coastal protective infrastructure of the Tohoku region.2, 3
The Chilean subduction zone provides the longest and most complete record of great earthquake recurrence in the instrumental era. The 1960 Valdivia earthquake (Mw 9.5), the most powerful earthquake ever recorded, generated a trans-Pacific tsunami that killed approximately 1,600 people in Chile and caused significant damage and casualties as far away as Hawaii, Japan, and the Philippines. Historical and geological evidence indicates that the south-central Chilean margin ruptures in great earthquakes at intervals of roughly 100 to 300 years, significantly shorter than the recurrence intervals at Cascadia, consistent with the faster convergence rate and stronger seismic coupling of the Nazca-South America plate boundary.13
Estimated recurrence intervals at major tsunamigenic subduction zones5, 6, 13
| Subduction zone | Largest known event | Estimated recurrence interval | Last great tsunami |
|---|---|---|---|
| Chile (south-central) | Mw 9.5 (1960) | ~100–300 years | 1960 |
| Cascadia | Mw ~9.0 (1700) | ~200–800 years (avg. ~500) | 1700 |
| Sumatra-Andaman | Mw 9.1 (2004) | ~400–600 years | 2004 |
| Japan Trench (Tohoku) | Mw 9.1 (2011) | ~800–1,100 years | 2011 |
| Alaska-Aleutian | Mw 9.2 (1964) | ~500–900 years | 1964 |
Probabilistic tsunami hazard assessment
The quantitative assessment of tsunami hazard draws on the methods of probabilistic seismic hazard analysis (PSHA) adapted for the specific physics of tsunami generation and propagation. Probabilistic tsunami hazard analysis (PTHA) integrates the frequency and magnitude distribution of potential tsunami sources, the propagation characteristics of the resulting waves, and the local coastal amplification effects to estimate the probability that a specified wave height will be exceeded at a given location within a defined time interval.13
The framework developed by Geist and Parsons combines computational tsunami modelling with empirical data from past events, using Monte Carlo simulations to sample the full range of possible earthquake rupture parameters (magnitude, location, fault geometry, slip distribution) weighted by their estimated probabilities of occurrence. For each sampled earthquake, a numerical tsunami model computes the resulting wave field and coastal runup, and the aggregate of thousands of such simulations produces a probabilistic hazard curve relating wave height to annual exceedance probability at each coastal site.13
A fundamental challenge in PTHA is the treatment of epistemic uncertainty, the uncertainty that arises from incomplete knowledge of the earthquake source characteristics, the wave propagation physics, and the coastal response. The 2011 Tohoku event demonstrated dramatically that the maximum magnitude assumed for a subduction zone in hazard models can be catastrophically wrong if it is based on a historical earthquake catalogue that spans only a fraction of the recurrence interval. This lesson has driven a shift toward broader uncertainty bounds in maximum magnitude estimates and greater reliance on paleotsunami and paleoseismic data to constrain the upper tail of the magnitude-frequency distribution.2, 13
Non-seismic tsunami sources present additional complexities. Submarine landslide tsunamis, volcanic tsunamis, and asteroid impact tsunamis each have distinct source characteristics, wave propagation properties, and recurrence statistics that must be treated separately in a comprehensive PTHA. Landslide-generated tsunamis are particularly challenging because the volume, velocity, and geometry of the failed mass are difficult to constrain probabilistically, and the resulting waves have shorter wavelengths and more complex propagation patterns than seismogenic tsunamis.12, 13, 14 Despite these difficulties, modern PTHA frameworks are being progressively expanded to incorporate all significant tsunami sources, producing increasingly comprehensive assessments of the total tsunami hazard at vulnerable coastlines worldwide.13, 15
Tsunamis in Earth history
The geological record preserves evidence of tsunamis spanning billions of years of Earth history, demonstrating that these events are an enduring consequence of the tectonic and impact processes that have shaped the planet. Beyond the Holocene paleotsunami deposits that inform modern hazard assessment, geologists have identified tsunami signatures in the deep geological record associated with major events in Earth history.8, 11
The Chicxulub impact tsunami, discussed above, left a distinctive sedimentary record across the Gulf of Mexico and Caribbean, including massive beds of reworked carbonate and clastic sediment, chaotic breccias, and cross-bedded sandstones that record the passage of enormous waves and their associated currents through the shallow seas surrounding the impact site. At sites more distant from the impact, the tsunami signature becomes subtler but is still detectable as erosional surfaces, graded beds, and displaced microfossils within the Cretaceous-Paleogene boundary interval.11
The sedimentary record also preserves evidence for tsunamis associated with other large bolide impacts, major volcanic eruptions, and tectonic events throughout the Phanerozoic and beyond. Identifying ancient tsunami deposits requires careful sedimentological analysis to distinguish them from storm deposits, turbidites, and other event beds, a task made more difficult by the increasing effects of diagenesis, deformation, and erosion on older deposits.8 Nevertheless, the study of paleotsunamis has become an essential tool for understanding the long-term frequency and magnitude of tsunami hazards, for constraining the slip histories of subduction zones over multiple seismic cycles, and for reconstructing the environmental consequences of catastrophic events in Earth's past.
The integration of paleotsunami research with modern observational and computational methods represents one of the most productive developments in the geosciences. By combining the deep-time perspective of geological field studies with the precision of numerical models and the real-time monitoring capabilities of global sensor networks, tsunami science has evolved from a largely descriptive discipline into a quantitative, predictive framework capable of informing hazard mitigation for the hundreds of millions of people who live on tsunami-vulnerable coastlines.5, 7, 13, 15
References
The 2011 magnitude 9.0 Tohoku-Oki earthquake: mosaicking the megathrust from seconds to centuries
Time and size of a giant earthquake in Cascadia inferred from Japanese tsunami records of January 1700
Fault slip and seismic moment of the 1700 Cascadia earthquake inferred from Japanese tsunami descriptions