Overview
- Earthquakes occur when accumulated elastic strain energy is suddenly released along geological faults, a process explained by Reid's elastic rebound theory and governed by the mechanical properties of fault zones in Earth's brittle crust.
- The development of seismographs, global seismic networks, and the moment magnitude scale has enabled precise measurement of earthquake size and location, while the distinct behaviors of P-waves, S-waves, and surface waves provide the observational foundation for both earthquake characterization and imaging Earth's deep interior.
- Seismology has revealed that the largest earthquakes concentrate at subduction zone megathrusts, that seismic hazard assessment can identify vulnerable regions decades before rupture, and that the study of how seismic waves traverse the planet has uncovered Earth's layered internal structure from crust to inner core.
Earthquakes are sudden releases of energy within Earth's lithosphere that generate seismic waves propagating outward from the source. They are among the most powerful and destructive natural phenomena, responsible for catastrophic loss of life and property throughout recorded history. Seismology, the scientific study of earthquakes and the propagation of seismic waves through the Earth, emerged as a quantitative discipline in the late nineteenth and early twentieth centuries and has since become one of the most productive branches of the geosciences. Beyond characterizing earthquakes themselves, seismology has provided the principal observational tool for determining the internal structure of the planet, revealing the concentric layers of crust, mantle, outer core, and inner core that define Earth's deep architecture.4, 14
The study of earthquakes draws on physics, geology, and engineering to explain why the Earth shakes, how that shaking can be measured and predicted, and what the consequences are for human societies built on an active planet. From the foundational insight of elastic rebound theory to the global networks of digital seismographs that now monitor the Earth in real time, seismology has transformed understanding of the forces that shape our planet's surface and interior.4, 22
Elastic rebound theory
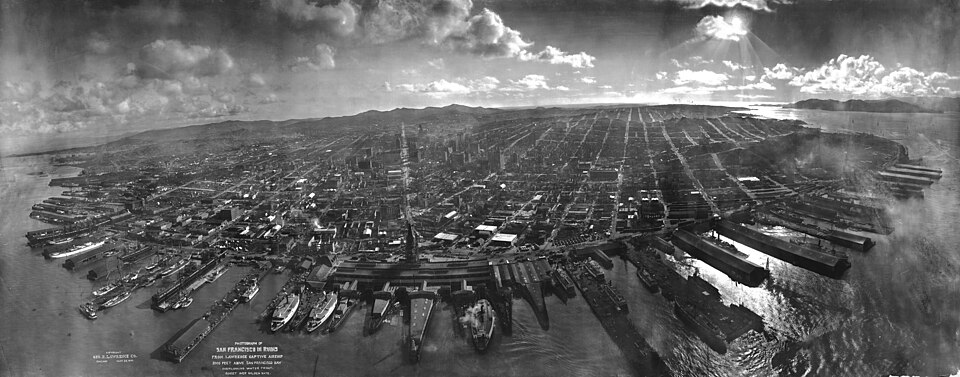
The modern understanding of earthquake mechanics began with the devastating San Francisco earthquake of 18 April 1906. In its aftermath, a State Earthquake Investigation Commission led by Andrew Lawson conducted an exhaustive study of the rupture along the San Andreas Fault, documenting lateral displacements of up to 6 metres along a 470-kilometre segment of the fault.1 Harry Fielding Reid, a member of the commission, analyzed geodetic survey data collected before and after the earthquake and proposed the elastic rebound theory, which remains the foundational model of earthquake generation.2
Reid observed that points on opposite sides of the San Andreas Fault had been gradually displaced relative to one another over the decades preceding the earthquake, bending the surrounding rock like a flexed bow. When the accumulated elastic strain exceeded the frictional strength of the fault, the locked segment ruptured, and the deformed rock on either side sprang back — or rebounded — to its undeformed shape, releasing the stored energy as seismic waves.2 The key insight was that earthquakes are not caused by sudden application of force but rather by the sudden release of slowly accumulated strain energy. The fault does not create the deformation; rather, tectonic forces deform the crust continuously, and the fault is merely the surface along which the inevitable failure occurs.
Elastic rebound theory predicts that after a large earthquake relieves the strain on a fault segment, that segment should be relatively quiet until sufficient strain reaccumulates to produce the next rupture. This concept underpins the seismic cycle — the recurring pattern of strain accumulation, fault locking, and sudden rupture that characterizes active fault zones worldwide. Geodetic measurements using GPS and satellite-based interferometric synthetic aperture radar (InSAR) have confirmed that interseismic strain accumulation along locked faults proceeds at rates consistent with the long-term geological slip rates, validating Reid's century-old model with modern precision.3
Fault types and tectonic settings
.jpg)
Earthquakes occur on faults, fracture surfaces along which rock masses on either side have moved relative to one another. The type of fault and the style of motion depend on the orientation and magnitude of the tectonic stresses acting on the rock. Three principal fault types are recognized, each associated with a distinct tectonic regime.3, 4
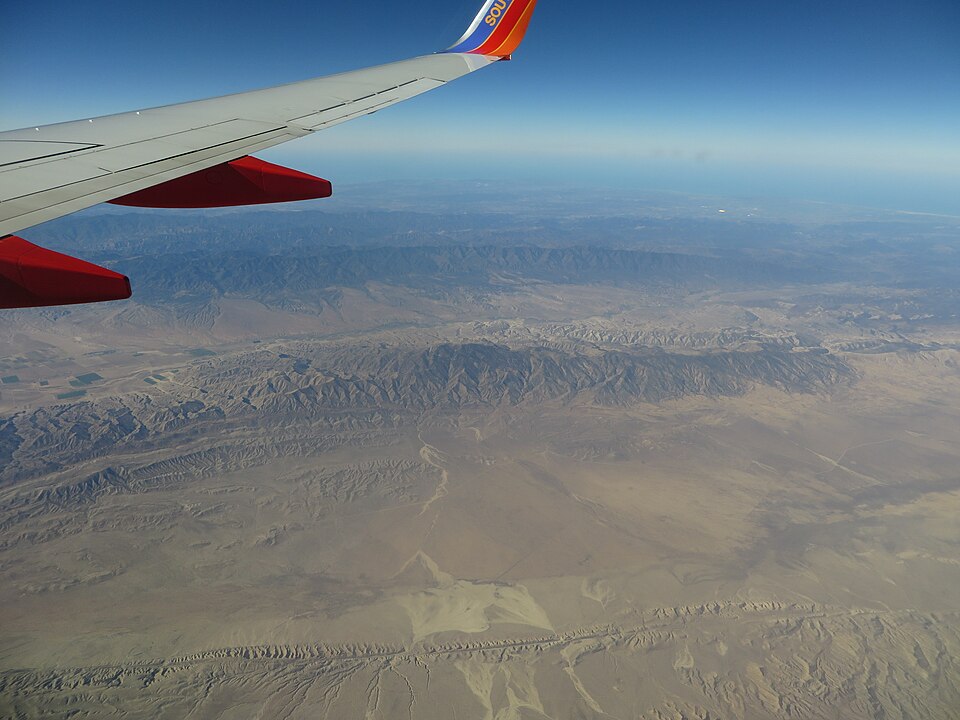
Normal faults occur in extensional environments where the crust is being pulled apart. The hanging wall (the block above the inclined fault plane) moves downward relative to the footwall. Normal faulting is characteristic of continental rift zones such as the East African Rift and the Basin and Range Province of the western United States, as well as divergent plate boundaries at mid-ocean ridges. Earthquakes on normal faults tend to be moderate in size, rarely exceeding magnitude 7.5, because the extensional stress regime limits the area of fault contact that can remain locked.3
Reverse faults (and their low-angle variants, thrust faults) occur in compressional environments where the crust is being shortened. The hanging wall moves upward relative to the footwall, thickening the crust and building topographic relief. Thrust faulting dominates at convergent plate boundaries, particularly along subduction zone megathrusts, and is responsible for the largest earthquakes on Earth. The 2004 Sumatra and 2011 Tohoku earthquakes, both exceeding magnitude 9, were megathrust events on gently dipping reverse faults at the interface between subducting and overriding plates.12, 13
Strike-slip faults accommodate lateral motion, with the two sides of the fault sliding horizontally past each other. They are classified as right-lateral (dextral) or left-lateral (sinistral) depending on the sense of motion. The San Andreas Fault in California is a right-lateral strike-slip fault forming the transform boundary between the Pacific and North American plates. The Anatolian faults in Turkey, the Alpine Fault in New Zealand, and the Dead Sea Transform are other prominent strike-slip systems. Strike-slip earthquakes can be highly destructive — the 1906 San Francisco earthquake and the 1999 Izmit earthquake in Turkey (Mw 7.6) were both strike-slip events — although they generally do not reach the magnitudes achieved by megathrust ruptures.1, 3
Seismic waves
When a fault ruptures, the elastic energy released radiates outward as seismic waves. These waves fall into two broad categories: body waves, which travel through Earth's interior, and surface waves, which propagate along the planet's surface. The distinct physical properties of these wave types are the foundation of both earthquake characterization and the seismological imaging of Earth's interior.5, 22
Primary waves (P-waves) are longitudinal compressional waves in which particle motion is parallel to the direction of wave propagation, analogous to sound waves in air. P-waves are the fastest seismic waves, traveling at approximately 5 to 8 kilometres per second through crustal rocks and up to 13.7 kilometres per second through Earth's inner core. Because they can propagate through both solids and fluids, P-waves traverse all layers of the Earth, including the liquid outer core.5, 6
Secondary waves (S-waves) are transverse shear waves in which particle motion is perpendicular to the direction of propagation. S-waves travel at roughly 60 to 70 percent of the velocity of P-waves in the same material — typically 3 to 5 kilometres per second in the crust. Crucially, S-waves cannot propagate through fluids because liquids do not support shear stress. The observation that S-waves from distant earthquakes fail to arrive at seismograph stations within a broad angular range on the far side of the Earth provided the definitive evidence that Earth possesses a liquid outer core, as demonstrated by Richard Dixon Oldham in 1906 and refined by Beno Gutenberg in 1913.14, 22
Surface waves are generated when body waves interact with Earth's free surface. Love waves produce horizontal shearing perpendicular to the direction of propagation and are confined to a shallow layer whose thickness depends on the wavelength. Rayleigh waves produce an elliptical retrograde particle motion in the vertical plane containing the propagation direction, similar to ocean surface waves. Surface waves travel more slowly than body waves but carry larger amplitudes and longer periods, making them the most destructive component of earthquake ground motion at regional distances. For large earthquakes, surface waves can circle the globe multiple times and be recorded for hours after the initial rupture.5, 22
Seismographs and seismic networks
.jpg)
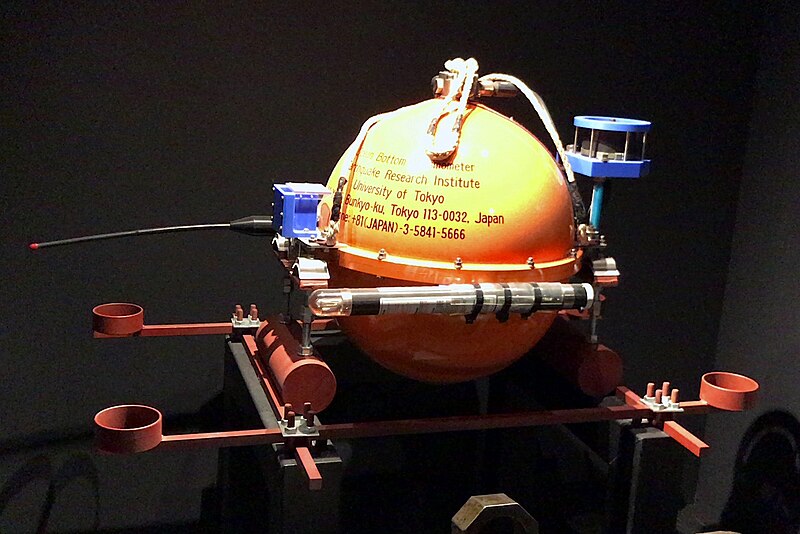
A seismograph is an instrument that detects and records ground motion caused by seismic waves. The fundamental principle is deceptively simple: a suspended mass with inertia tends to remain stationary while the instrument frame, attached to the ground, moves with the passing wave. The relative motion between the mass and the frame is recorded as a seismogram. Early seismographs, developed in the late nineteenth century by John Milne, Fusakichi Omori, Emil Wiechert, and others, used mechanical levers and smoked paper to amplify and record the motion.17
The twentieth century saw progressive refinement from mechanical to electromagnetic to electronic instruments. The Galitzin seismograph, introduced around 1910, used electromagnetic transducers to convert ground motion into electrical signals, enabling photographic recording and greatly improving sensitivity and dynamic range.17 By the mid-twentieth century, the establishment of the World-Wide Standardized Seismograph Network (WWSSN) in the early 1960s — motivated in part by the need to monitor nuclear weapons tests — provided the first truly global network of calibrated instruments, and its data proved instrumental in confirming plate tectonics theory by mapping the global distribution of earthquakes along plate boundaries.4, 21
Modern broadband digital seismographs record ground motion across a wide frequency range (roughly 0.001 to 100 hertz) with extraordinary sensitivity, capable of detecting ground displacements smaller than a nanometre. The Global Seismographic Network (GSN), jointly operated by the Incorporated Research Institutions for Seismology (IRIS), the United States Geological Survey (USGS), and the University of California San Diego, comprises more than 150 stations distributed worldwide, transmitting data in real time via satellite. Regional and national networks add thousands more stations, enabling rapid detection, location, and characterization of earthquakes within minutes of their occurrence.21
Magnitude scales
The quantitative measurement of earthquake size has been one of seismology's central achievements. The first widely adopted magnitude scale was developed in 1935 by Charles F. Richter for local earthquakes in southern California. The Richter local magnitude (ML) is defined as the base-10 logarithm of the maximum amplitude recorded on a standard Wood-Anderson seismograph at a distance of 100 kilometres from the epicentre, with corrections for the actual distance.7 The logarithmic scale means that each whole-number increase in magnitude corresponds to a tenfold increase in recorded amplitude. Richter's scale was revolutionary in providing an objective, instrumental measure of earthquake size, replacing subjective intensity assessments.
However, the Richter scale has significant limitations. It was calibrated for a specific instrument and distance range, and for very large earthquakes (above about magnitude 7) the scale saturates — that is, the recorded amplitudes stop increasing proportionally with the true size of the event because the short-period waves used in the measurement do not capture the full extent of the rupture.8, 9
To overcome these limitations, Hiroo Kanamori and Thomas C. Hanks introduced the moment magnitude scale (Mw) in 1977 and 1979. Moment magnitude is derived from the seismic moment (M0), a physical quantity defined as the product of the fault area that ruptured, the average displacement on the fault, and the rigidity (shear modulus) of the surrounding rock. The relationship is Mw = (2/3) log10(M0) − 10.7, where M0 is measured in dyne-centimetres.8, 9 Because seismic moment is a direct measure of the total energy released by the earthquake, moment magnitude does not saturate and provides a physically meaningful measure of size across the entire range of observed earthquakes. It has become the standard scale used by seismological agencies worldwide for reporting earthquake magnitudes.
The relationship between magnitude and energy is steeply nonlinear: each unit increase in moment magnitude corresponds to approximately a 31.6-fold increase in energy release. A magnitude 9 earthquake releases roughly 31,600 times more energy than a magnitude 7 event and about one million times more energy than a magnitude 5 event.9
Energy release by earthquake magnitude8, 9
Locating earthquakes
Determining where an earthquake occurred is one of the most fundamental tasks in seismology. The location of an earthquake is specified by its hypocentre (or focus), the point within the Earth where the rupture initiated, and its epicentre, the point on the surface directly above the hypocentre. The standard method of earthquake location exploits the difference in travel times between P-waves and S-waves.4, 10
Because P-waves travel faster than S-waves, they arrive at a seismograph station before the S-waves. The time interval between the P-wave and S-wave arrivals (the S-P interval) increases with distance from the earthquake source. By reading the S-P interval at a single station and consulting empirically derived travel-time tables, a seismologist can estimate the distance to the earthquake but not the direction. When three or more stations record the same event, the distances define circles on a map whose intersection identifies the epicentre — a procedure known as trilateration.4
Modern earthquake location uses far more sophisticated techniques. Global and regional travel-time models, such as the IASP91 and AK135 models, provide predicted arrival times for dozens of seismic phases (direct P, reflected PcP, core-refracted PKP, and many others) as a function of distance and depth.10 By comparing observed arrival times at many stations with predicted times, automated algorithms solve for the hypocentral coordinates and origin time that best fit the observations in a least-squares sense. Dense local networks can locate nearby earthquakes to within a few hundred metres, while teleseismic events (those recorded at great distances) are typically located with uncertainties of 10 to 20 kilometres.10, 20
Notable earthquakes in the instrumental era
The instrumental record of earthquakes, beginning in the late nineteenth century and reaching global coverage in the mid-twentieth century, has documented thousands of significant events. Three earthquakes in particular illustrate the range of tectonic settings, societal impacts, and scientific lessons that seismology has provided.
The 1906 San Francisco earthquake (estimated Mw 7.9) remains one of the most consequential earthquakes in scientific history. The rupture extended approximately 470 kilometres along the San Andreas Fault, a right-lateral strike-slip boundary between the Pacific and North American plates. Maximum lateral displacements of 6 metres were observed near the town of Olema in Marin County. The earthquake and resulting fires destroyed much of San Francisco, killed an estimated 3,000 people, and left more than half the city's population homeless. Its scientific legacy was equally profound: the detailed field investigations by the Lawson Commission and Reid's formulation of elastic rebound theory established the conceptual framework that still governs earthquake science today.1, 2, 11
The 2004 Sumatra-Andaman earthquake (Mw 9.1) ruptured approximately 1,300 kilometres of the subduction interface between the Indo-Australian Plate and the Sunda Plate in a sequence lasting roughly ten minutes. Peak fault slip reached approximately 15 metres. The seafloor displacement generated a trans-oceanic tsunami that killed approximately 230,000 people across fourteen countries bordering the Indian Ocean, making it the deadliest natural disaster of the twenty-first century. The event demonstrated that subduction zones previously thought too segmented to rupture in a single event could in fact produce magnitude 9 earthquakes, and it led directly to the establishment of tsunami warning systems in the Indian Ocean.12
The 2011 Tohoku-Oki earthquake (Mw 9.1) ruptured approximately 500 kilometres of the Japan Trench megathrust off the northeastern coast of Honshu, with a maximum slip of roughly 50 metres near the trench axis — an extraordinarily large displacement that extended to shallower depths than seismologists had considered possible on this fault segment. The resulting tsunami inundated the coast with waves exceeding 15 metres and triggered the Fukushima Daiichi nuclear disaster. Japan's dense seismic and geodetic networks provided an unprecedented dataset that fundamentally revised understanding of the seismic potential of the Japan Trench, which prior hazard assessments had deemed incapable of producing a magnitude 9 event.13
Selected major earthquakes in the instrumental era12, 13, 18, 20
| Earthquake | Date | Mw | Fault type | Fatalities |
|---|---|---|---|---|
| Valdivia, Chile | 22 May 1960 | 9.5 | Megathrust | ~1,655 |
| Alaska (Prince William Sound) | 28 Mar 1964 | 9.2 | Megathrust | 131 |
| Sumatra-Andaman | 26 Dec 2004 | 9.1 | Megathrust | ~230,000 |
| Tohoku-Oki, Japan | 11 Mar 2011 | 9.1 | Megathrust | ~19,750 |
| Kamchatka, Russia | 4 Nov 1952 | 9.0 | Megathrust | ~2,336 |
| San Francisco, USA | 18 Apr 1906 | 7.9 | Strike-slip | ~3,000 |
| Tangshan, China | 28 Jul 1976 | 7.5 | Strike-slip | ~242,000 |
| Haiti | 12 Jan 2010 | 7.0 | Reverse | ~100,000–316,000 |
Seismic hazard assessment
The devastating consequences of earthquakes have motivated systematic efforts to assess and mitigate seismic hazard — the probability that a given level of ground shaking will be exceeded at a particular site within a specified time interval. The modern framework for probabilistic seismic hazard analysis (PSHA) was established by C. Allin Cornell in 1968, who combined the spatial distribution of earthquake sources, the frequency-magnitude relationship (the Gutenberg-Richter law, which states that the logarithm of the number of earthquakes above a given magnitude decreases linearly with magnitude), and ground-motion attenuation relationships to compute the probability of exceeding any specified level of shaking at a site.15, 19
The Gutenberg-Richter frequency-magnitude relationship, established empirically by Beno Gutenberg and Charles Richter in 1944, holds that log10(N) = a − bM, where N is the number of earthquakes with magnitude greater than or equal to M, and a and b are constants. The b-value is remarkably stable at approximately 1.0 for most tectonic settings, meaning that for every magnitude 5 earthquake in a region, there are roughly ten magnitude 4 events, one hundred magnitude 3 events, and so on.19 This relationship provides the statistical foundation for estimating the recurrence rates of earthquakes of any given size in a region.
The Global Seismic Hazard Assessment Program (GSHAP), completed in 1999 under the auspices of the International Lithosphere Programme, produced the first uniform worldwide map of seismic hazard, expressed as peak ground acceleration with a 10 percent probability of exceedance in 50 years. The map identified the Alpine-Himalayan belt, the circum-Pacific subduction zones, and the East African Rift as the regions of highest hazard, consistent with the known distribution of active plate boundaries and intraplate seismic zones.16 National seismic hazard models, such as those produced by the USGS for the United States and by the European Seismic Hazard Model (ESHM) for Europe, underpin building codes and land-use planning, translating probabilistic hazard estimates into engineering design parameters that determine the earthquake resistance of structures.15, 23
The 2011 Tohoku earthquake exposed significant limitations in hazard assessment practice. The maximum magnitude assumed for the Japan Trench in prior assessments was approximately 8.2 to 8.4, based on the historical earthquake catalogue, which extended back only a few centuries. The occurrence of a magnitude 9.1 event demonstrated that short historical records can severely underestimate the seismic potential of a fault, and it prompted a global reassessment of maximum magnitude assumptions at subduction zones worldwide.13, 23
Seismology and Earth's interior
Perhaps the most far-reaching contribution of seismology has been the discovery and characterization of Earth's internal structure. Because seismic waves change velocity, refract, and reflect when they encounter boundaries between materials of different elastic properties, the arrival times and waveforms recorded at distant stations act as a natural probe of the planet's deep interior. Virtually everything known about the composition and physical state of the Earth below the deepest boreholes — which penetrate only the uppermost 12 kilometres of the crust — has been inferred from seismological observations.14, 22
In 1906, Richard Dixon Oldham analyzed the travel times of P-waves and S-waves from large earthquakes and identified a central core in which S-waves were absent, providing the first seismological evidence for a liquid region within the Earth.14 In 1909, Andrija Mohorovicic discovered a sharp increase in seismic velocity at a depth of approximately 30 to 50 kilometres beneath continents, marking the boundary between the crust and the mantle — now called the Mohorovicic discontinuity (Moho). In 1913, Beno Gutenberg refined the depth of the core-mantle boundary to approximately 2,900 kilometres. And in 1936, Inge Lehmann demonstrated the existence of a solid inner core within the liquid outer core by analyzing P-wave arrivals that had been reflected from an internal boundary at approximately 5,150 kilometres depth.6, 22
The Preliminary Reference Earth Model (PREM), published by Adam Dziewonski and Don Anderson in 1981, synthesized decades of seismological data into a comprehensive one-dimensional model of seismic velocities, density, and elastic properties as a function of depth throughout the entire planet. PREM remains the standard reference model against which three-dimensional variations are measured.6 Modern seismic tomography extends this approach into three dimensions, using millions of travel-time and waveform measurements to construct images of the mantle's velocity structure. Tomographic images have revealed subducted slabs descending to the core-mantle boundary, broad low-velocity provinces beneath Africa and the Pacific interpreted as thermochemical anomalies, and narrow plume-like conduits rising from the deep mantle — observations that have fundamentally shaped understanding of mantle convection and plate dynamics.24
Seismology thus serves a dual purpose. It is at once the science of earthquakes — their causes, characteristics, and consequences — and the primary observational tool for exploring the otherwise inaccessible interior of the planet. The same waves that cause destruction at the surface carry within their travel times and waveforms a detailed record of the materials they have traversed, making every earthquake a source of illumination for the deep Earth.22, 24
References
The California earthquake of April 18, 1906: Report of the State Earthquake Investigation Commission
The 2011 magnitude 9.0 Tohoku-Oki earthquake: mosaicking the megathrust from seconds to centuries