Overview
- Permafrost is ground that remains at or below 0°C for at least two consecutive years, underlying roughly 15 percent of the exposed land area of the Northern Hemisphere and storing approximately 1,300 petagrams of organic carbon — nearly twice as much as is currently in the atmosphere.
- The thermal regime of permafrost terrain is dominated by an active layer that thaws each summer and refreezes each winter, with a perennially frozen substrate beneath; ground ice in the form of pore ice, segregated lenses, and large wedge ice produces a distinctive suite of periglacial landforms including ice-wedge polygons, pingos, palsas, and thermokarst features.
- Global ground temperature monitoring through the GTN-P network has documented a mean warming of permafrost of 0.29°C between 2007 and 2016, with the highest rates in the cold continuous zone of Siberia, and IPCC projections indicate that 25 to 70 percent of near-surface permafrost will thaw by 2100 depending on the emissions trajectory, releasing CO₂ and methane in a self-reinforcing climate feedback.
Permafrost is ground — soil, sediment, or rock — that remains at or below 0°C for at least two consecutive years. The definition is purely thermal: it makes no reference to the presence of ice, the lithology of the substrate, or the depth at which freezing temperatures persist. Most permafrost contains some quantity of frozen water, but dry permafrost in well-drained gravels and bedrock can also satisfy the criterion. Permafrost underlies roughly 15 percent of the exposed land area of the Northern Hemisphere, extending across vast tracts of Siberia, the Canadian and Alaskan Arctic, the Tibetan Plateau, the Andes, and the high mountain ranges of the world, and it occurs as well beneath the floors of shallow Arctic seas where it formed during the lower sea levels of the last glaciation.1, 3 The total volume of perennially frozen ground holds roughly 1,300 petagrams of organic carbon — nearly twice as much carbon as is presently contained in the atmosphere — and the response of this enormous reservoir to a warming climate constitutes one of the most consequential uncertainties in projections of Earth's near-term climate trajectory.7, 8
The study of permafrost is a relatively young science. The Russian geologist Mikhail Sumgin coined the term vechnaya merzlota — "eternal frost" — in 1927, and the modern English word permafrost was introduced by Siemon Muller in 1943. Systematic mapping and instrumented monitoring of frozen ground accelerated only after the Second World War, driven by the needs of Arctic infrastructure construction and the geopolitical importance of the polar regions during the Cold War. The discipline that studies permafrost and the suite of cold-climate, non-glacial processes that occur in its presence is called periglacial geomorphology, or, when emphasis is placed on the frozen ground itself, geocryology.1 The contemporary understanding of permafrost as a global phenomenon, integrated into Earth's climate system and intimately bound to Quaternary ice age dynamics, has emerged from the convergence of field observation, borehole thermometry, remote sensing, and numerical modelling over the past half-century.
Definition and classification
The thermal definition of permafrost — ground at or below 0°C for at least two consecutive years — was formalised by Soviet permafrost scientists in the 1930s and remains the international standard.1 Critically, the definition specifies a temperature, not a phase: ground containing salty pore water can remain unfrozen well below 0°C, and dry rock at sub-zero temperatures qualifies as permafrost even though it contains no ice. The two-year minimum distinguishes true permafrost from seasonally frozen ground that thaws every summer.
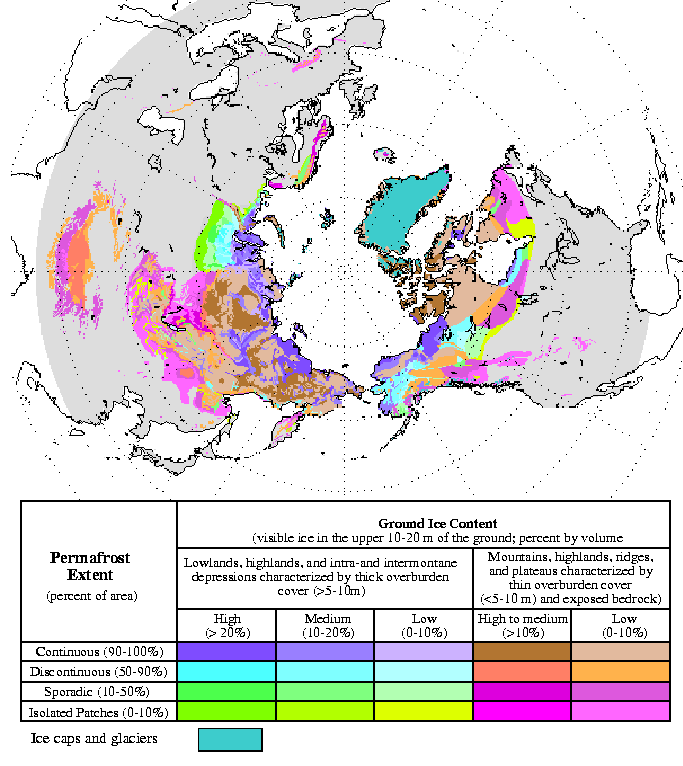
Permafrost terrain is divided into latitudinal zones based on the percentage of the ground surface underlain by frozen ground. The continuous zone, where more than 90 percent of the surface is permafrost, occupies the cold cores of the Arctic and the high-elevation interiors of central Siberia and the Canadian Arctic Archipelago. The discontinuous zone (50 to 90 percent permafrost) forms a broad belt around the continuous zone, where unfrozen patches develop beneath lakes, rivers, south-facing slopes, and areas of thicker snow cover. The sporadic zone (10 to 50 percent) occurs where permafrost is restricted to particularly favourable sites such as peatlands and shaded north-facing slopes, and the isolated patches zone (less than 10 percent) marks the southernmost limit of frozen ground, where permafrost survives only in exceptionally protected microenvironments.1, 2 The boundaries between these zones correspond approximately to mean annual air temperature isotherms of about −6°C (continuous), −1 to −4°C (discontinuous), and 0 to −1°C (sporadic), although vegetation, snow cover, soil moisture, and substrate properties can shift the actual permafrost limit by several degrees in either direction.
Permafrost zones of the Northern Hemisphere2, 3
| Zone | Areal coverage | Mean annual air T | Typical thickness | Example regions |
|---|---|---|---|---|
| Continuous | >90% | <−6°C | 100–1,500 m | Yakutia, North Slope of Alaska, Canadian Arctic Archipelago |
| Discontinuous | 50–90% | −1 to −6°C | 10–100 m | Interior Alaska, Yukon, southern Siberia, northern Fennoscandia |
| Sporadic | 10–50% | 0 to −2°C | <30 m | Northern boreal forest, Hudson Bay Lowlands, southern Lapland |
| Isolated patches | <10% | 0 to −1°C | <10 m | Southern margin of permafrost, peatlands and palsa fields |
The thickness of permafrost varies enormously, from a few decimetres in the southern sporadic zone to more than 1,500 metres in the coldest continuous regions. The thickest permafrost on Earth has been measured in the unglaciated interior of central and eastern Siberia, where the ancient sedimentary basins of Yakutia preserve frozen ground extending to depths of approximately 1,650 metres beneath the Markha River drainage and to comparable depths beneath the Yana-Indigirka lowlands.1 These extraordinary thicknesses reflect both the severity of the long-term mean climate of the Siberian interior and the absence of insulating ice sheets during the Pleistocene glaciations: in regions covered by thick continental ice during the last glacial maximum, the geothermal heat flux from below could not escape to the surface and the underlying ground actually warmed, whereas the unglaciated cold deserts of Beringia and central Siberia froze progressively deeper through repeated cold cycles.
Permafrost is also classified according to its position relative to the surface and the sea. Onshore or terrestrial permafrost is the most familiar type. Subsea permafrost underlies the floors of shallow Arctic seas, particularly the East Siberian, Laptev, and Beaufort shelves, where it formed when sea levels were 120 metres lower during the last glacial maximum and the continental shelves were exposed to frigid Arctic air for tens of thousands of years.16 Mountain or alpine permafrost occurs in high-elevation areas at all latitudes, including the European Alps, the Tibetan Plateau, the high Andes, and the equatorial mountains of East Africa and New Guinea, where the thermal regime is controlled by elevation rather than latitude. Finally, relict permafrost is frozen ground inherited from a colder past climate that persists in equilibrium with current conditions only because the heat required to thaw it has not yet been delivered through the overlying active layer.1
Global distribution and area
The first comprehensive synthesis of the global distribution of permafrost was the Circum-Arctic Map of Permafrost and Ground-Ice Conditions compiled by Jerry Brown, Oscar Ferrians, J. Alan Heginbottom, and Evgeny Melnikov for the International Permafrost Association (IPA) in 1997. This 1:10,000,000-scale map integrated decades of national and regional permafrost mapping from Russia, Canada, the United States, and the Nordic countries, and it became the standard reference for the boundaries of the four permafrost zones across the Northern Hemisphere.2 The Brown et al. map estimated that permafrost regions, broadly defined to include all four zones, occupy approximately 23 million square kilometres, or roughly 24 percent of the exposed land area of the Northern Hemisphere.
More recent satellite-driven and model-based mapping has refined these earlier estimates and clarified the important distinction between the permafrost region (the area within which any permafrost exists) and the permafrost area (the area actually underlain by frozen ground). The TTOP (temperature at the top of permafrost) modelling of Obu and colleagues, which combined remote-sensing land-surface temperatures, modelled snow conditions, and a global soil database to estimate ground temperatures at one-kilometre resolution, calculated that the modelled permafrost area covers approximately 13.9 million square kilometres, or about 15 percent of the exposed land area, while the broader permafrost region with non-zero permafrost probability extends to roughly 21 million square kilometres.3, 4 The discrepancy between the two figures reflects the patchy distribution of permafrost in the discontinuous, sporadic, and isolated zones, where large areas of unfrozen ground are interspersed with frozen patches.
Russia contains by far the largest area of permafrost of any country, with frozen ground underlying approximately two-thirds of its national territory, including almost the entire Far East and Siberia north of the 60th parallel. Canada ranks second, with permafrost covering approximately 50 percent of its land area, predominantly across the territories and northern provinces. Alaska and Greenland follow, and smaller but significant areas of permafrost occur in Mongolia, China (chiefly the Tibetan Plateau and the Da Hinggan mountains), Norway, Sweden, Finland, and Iceland.1, 3 The Tibetan Plateau is the largest area of high-altitude permafrost on Earth, with frozen ground beneath approximately 1.5 million square kilometres at elevations above 4,000 metres. In the Southern Hemisphere, permafrost is restricted to small portions of the Andes, the high mountains of New Zealand, and the ice-free margins of Antarctica.
Thermal regime and the active layer
The thermal structure of permafrost terrain is organised vertically into three units. At the top is the active layer, the surface zone that thaws each summer and refreezes each winter. Beneath the active layer lies the permafrost table, the upper boundary of perennially frozen ground, and beneath that is the body of permafrost itself, which extends downward to the depth at which the geothermal heat flux from Earth's interior raises the temperature back above 0°C.1 Within the permafrost body, ground temperature first decreases with depth from the surface, reaches a minimum at the depth of zero annual amplitude (typically 10 to 20 metres, where seasonal variations from above no longer reach), and then increases steadily downward at a rate determined by the local geothermal gradient, which averages roughly 25°C per kilometre. The base of permafrost is reached where this rising temperature curve crosses the 0°C isotherm.
The active layer is the most dynamic and ecologically important part of any permafrost landscape. Its thickness varies from a few centimetres in the coldest, peat-insulated tundra of the High Arctic to several metres in the warmest sites of the southern discontinuous zone, and it controls the depth available for plant rooting, microbial activity, hydrologic flow, and the seasonal exchange of water and heat between the atmosphere and the frozen ground below. Active layer thickness depends on the summer thawing index (the integrated above-zero air temperatures over the warm season), the thermal properties and moisture content of the soil, the insulating effect of vegetation and surface organic layers, and the duration and depth of the snow cover that determines how much winter cold can penetrate the ground.13
Systematic measurement of active layer thickness across the global permafrost region is conducted by the Circumpolar Active Layer Monitoring (CALM) network, established in 1991 and now comprising more than 250 sites in 15 countries. The standard CALM protocol uses mechanical probing of late-season thaw depth on regular grids, typically 100 metres by 100 metres or one kilometre square, providing direct measurements that complement borehole thermometry and remote-sensing estimates.14 The companion programme of borehole ground temperature monitoring is the Global Terrestrial Network for Permafrost (GTN-P), coordinated by the International Permafrost Association, which gathers temperature time series from approximately 1,000 boreholes spanning North America, Russia, Europe, and the polar regions. The GTN-P time series have become the principal global data set for documenting the response of permafrost temperatures to climate change.5, 6
Ground ice and cryostructures
The ice content of permafrost varies from less than 5 percent by volume in dry, coarse-grained substrates to more than 80 percent in ice-rich silts and ice complexes. Ground ice occurs in several distinct forms, each produced by a different freezing process and each producing characteristic structural patterns visible in exposed permafrost sections. Pore ice fills the spaces between mineral grains and represents the simplest mode of in-place freezing of water already present in the soil. Segregated ice forms as discrete lenses, layers, or veins that grow when liquid water migrates through unfrozen soil under gradients of temperature and water potential and freezes onto the underside of an advancing freezing front. The amount of ice that can accumulate by segregation depends on the rate of freezing, the water supply from below, and the texture of the soil: silty soils with abundant capillary water are particularly conducive to thick segregated ice formation, while dry sands and gravels are not.1
Wedge ice grows as vertical, downward-tapering bodies of ice that develop along thermal contraction cracks in the frozen ground (described in detail in the next section). Intrusive ice forms when water under pressure is injected into freezing sediment and freezes in place as massive bodies, producing the cores of pingos and other ice-cored mounds. Finally, buried ice represents glacier ice, snowbank ice, or river ice that was incorporated into a sediment column and subsequently preserved within permafrost; it is found particularly in formerly glaciated terrains where stagnant ice was buried under glacial debris.1
The arrangement of ice and mineral matter within frozen ground is described as the cryostructure of the permafrost. Ice-poor permafrost displays a structureless cryostructure in which all ice is contained in pores. Ice-rich permafrost displays banded, lenticular, reticulate, or layered cryostructures in which segregated ice forms a visible internal architecture. The most ice-rich permafrost on Earth is found in the Yedoma Ice Complex of Beringia, where ice content can locally exceed 80 percent by volume and ice wedges several metres wide penetrate the entire thickness of the deposit.9, 25 The total volume of ground ice in the Northern Hemisphere permafrost domain is estimated at several hundred thousand cubic kilometres, comparable in magnitude to the volume of ice contained in some smaller mountain glacier systems.
Periglacial landforms: ice wedges, pingos, palsas, and thermokarst
The presence of permafrost generates a distinctive suite of landforms that have no counterpart in temperate or tropical landscapes. The most characteristic of these are ice-wedge polygons, pingos, palsas, and the various subsidence features collectively termed thermokarst.
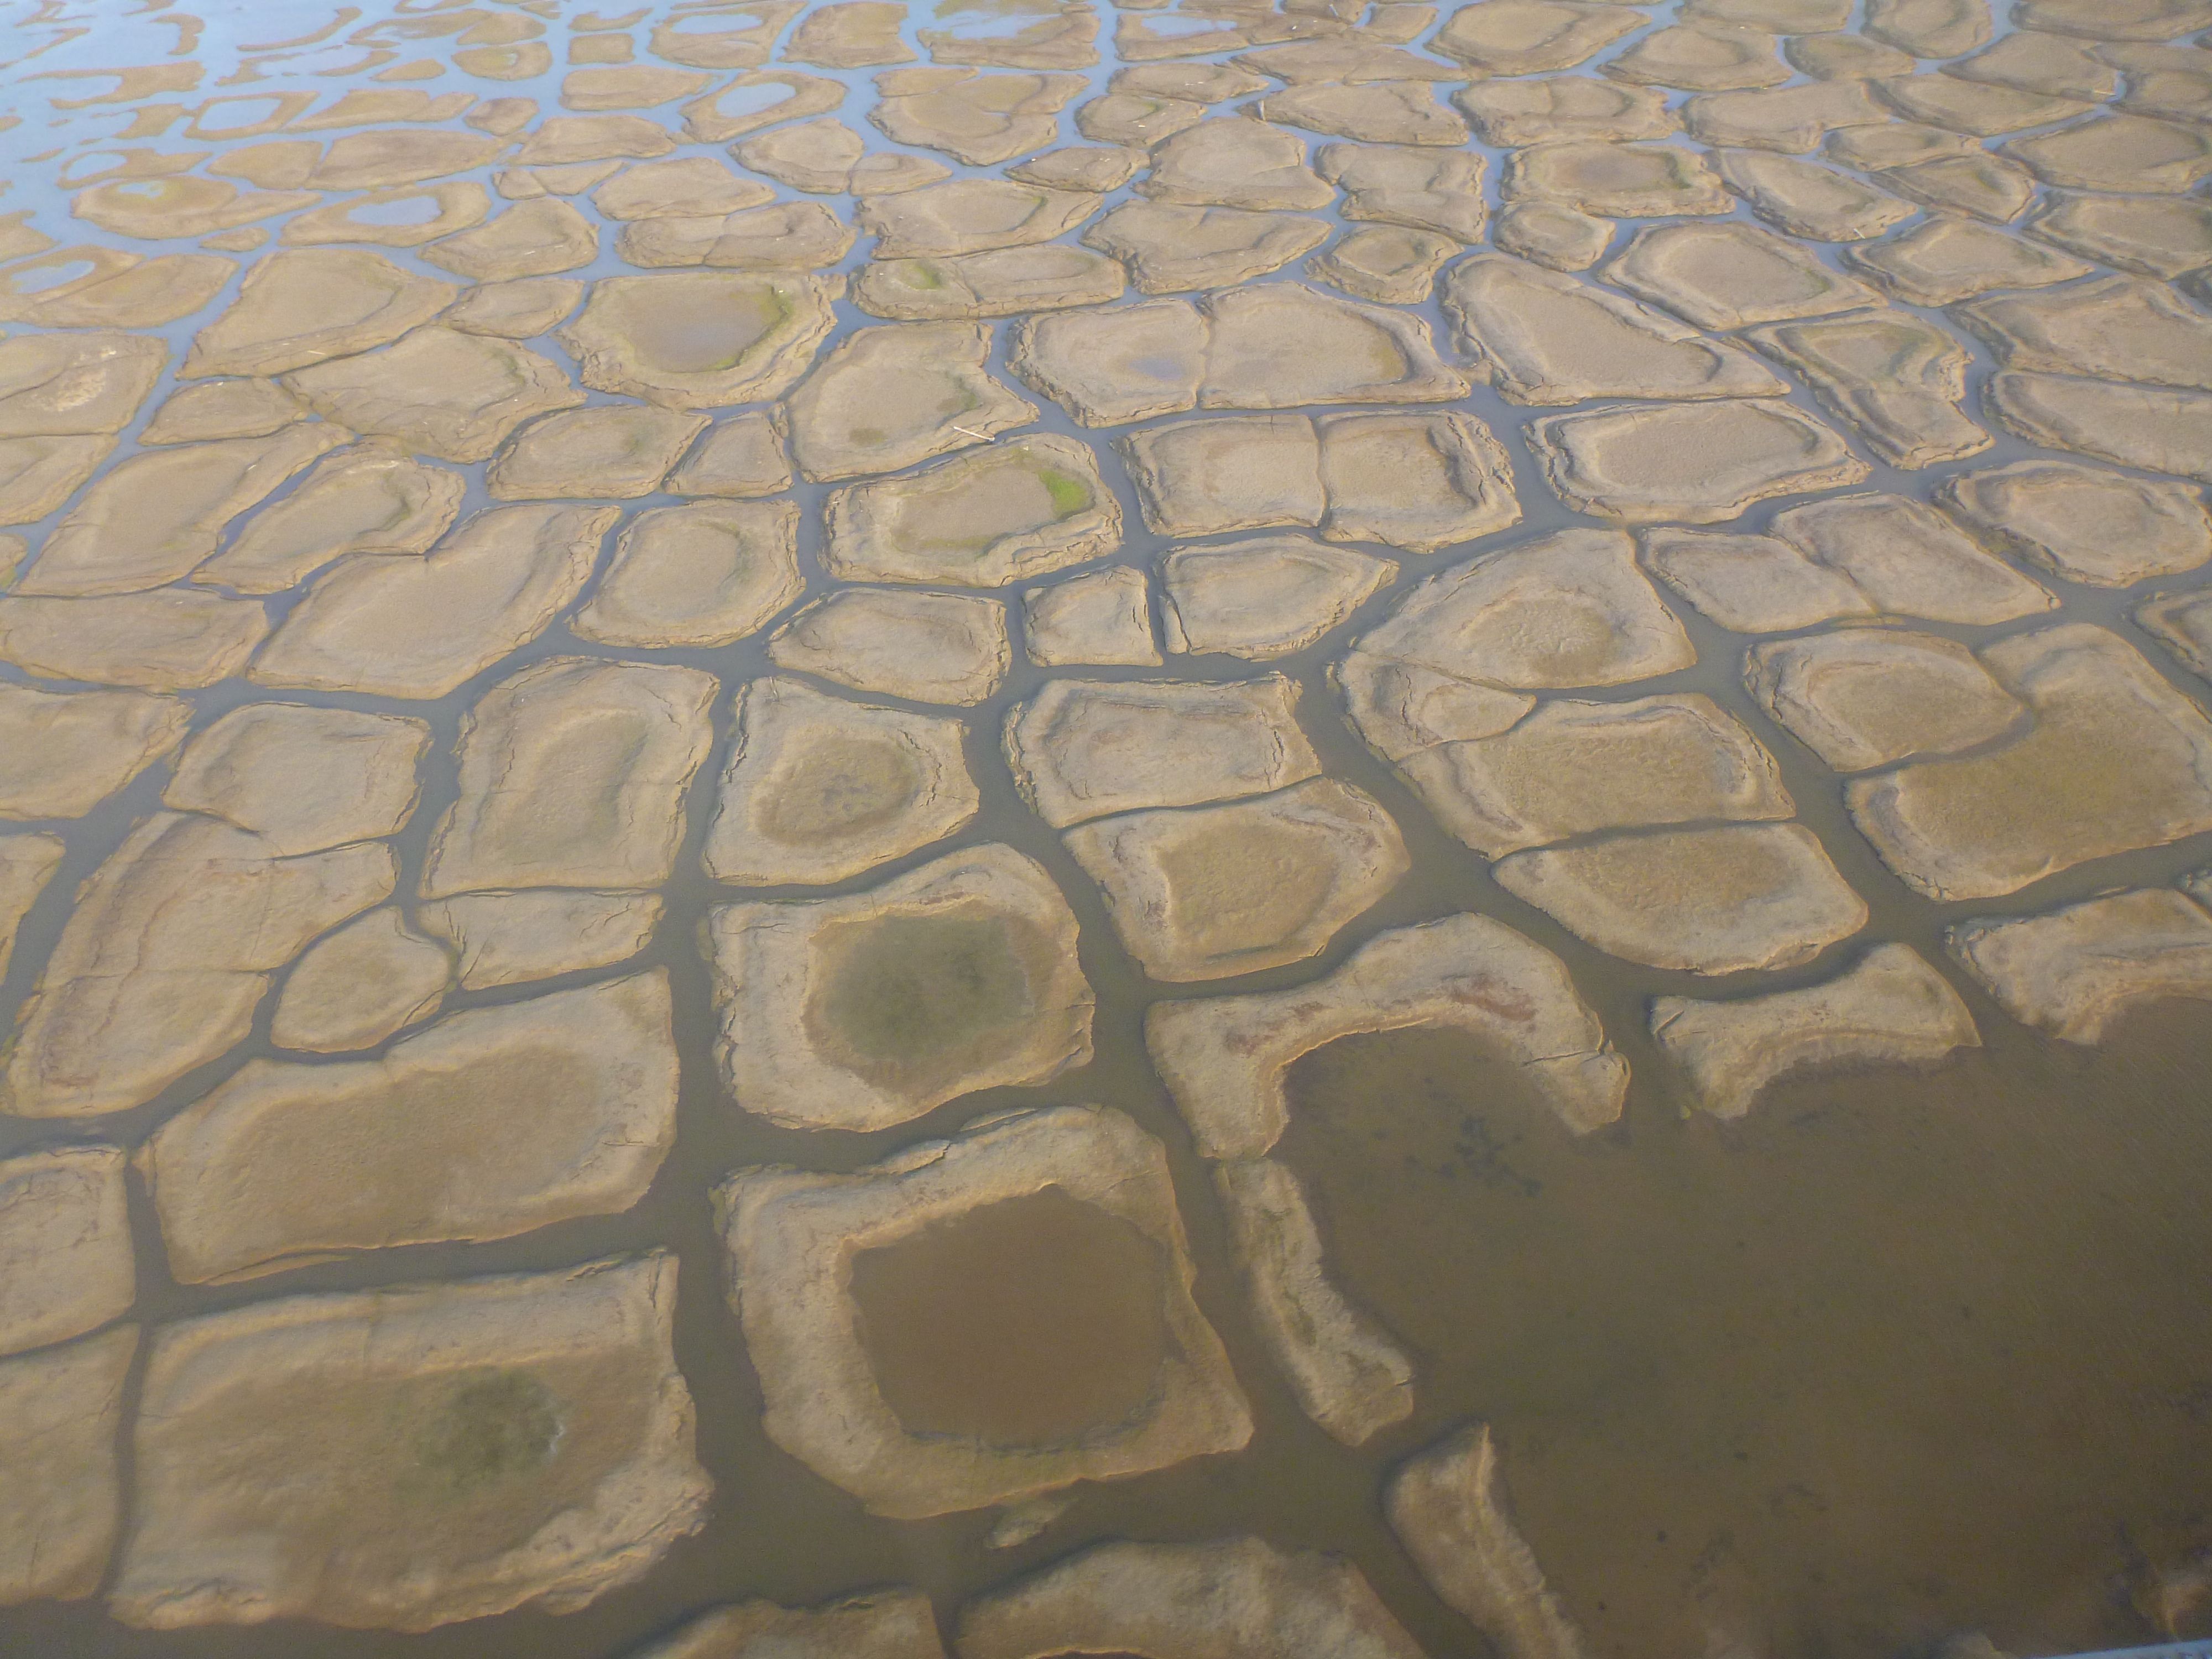
Ice-wedge polygons form by repeated thermal contraction cracking of the frozen ground during the cold of winter. When the surface temperature of the permafrost drops sufficiently rapidly to a sufficiently cold value — typically below about −15°C with a strong cooling rate — the ground contracts and fractures, opening narrow vertical cracks that may extend several metres into the permafrost. The following spring, meltwater enters these cracks and freezes, forming a thin vertical vein of ice. The next winter, contraction reopens the same crack along its line of weakness, and another increment of meltwater freezes within it. Over hundreds to thousands of years, this annual increment of vein ice accumulates into a wedge-shaped body that can be several metres wide and many metres deep. The American geophysicist Arthur Lachenbruch provided the first quantitative mechanical analysis of this process in his 1962 monograph for the Geological Society of America, in which he showed that the polygonal pattern naturally arises from the interaction of multiple contraction cracks intersecting on the surface.10 The resulting network of polygons, typically 10 to 30 metres across, blankets enormous areas of the Arctic Coastal Plain of Alaska, the Yamal Peninsula, the Lena Delta, and the polar deserts of the Canadian Arctic Archipelago.
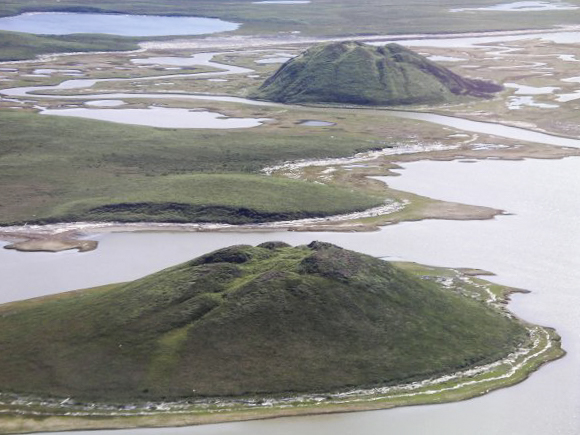
Pingos are conical hills with a core of intrusive ice, ranging from a few metres to more than 70 metres in height and from tens of metres to several hundred metres in diameter. The Inuktitut word pingo ("small hill") was adopted into the scientific literature by the Danish-Greenlandic explorer Alfred Steensby in the early twentieth century and became the standard international term. Two principal types are distinguished. Closed-system pingos form in flat, poorly drained terrain where a body of unfrozen water beneath a recently drained lake basin or shallow depression is gradually trapped between an advancing freezing front from above and the surrounding permafrost. The progressive freezing of this confined water generates hydrostatic pressure that pushes the overlying frozen sediment upward, building a mound with an ice core. The Mackenzie Delta and Tuktoyaktuk Peninsula of northwestern Canada contain the world's densest population of closed-system pingos, with more than 1,400 catalogued examples; the long-term observational programme conducted there by J. Ross Mackay over half a century has provided the principal field record of pingo growth, ranging from a few centimetres per year for mature pingos to several decimetres per year during the early growth phase.11 Open-system pingos, by contrast, form on slopes or in valley bottoms where groundwater flowing under hydraulic head from a sub-permafrost aquifer or a permafrost talik freezes near the surface, accumulating ice as the supply continues. Open-system pingos are common in interior Alaska, eastern Siberia, and the Yukon.
Palsas are smaller mounds, typically one to seven metres in height and tens of metres across, that develop in subarctic peatlands of the discontinuous and sporadic permafrost zones. They consist of a permafrost core of frozen peat or silt, often containing segregated ice lenses, capped by a thin active layer. The Finnish geomorphologist Matti Seppälä and his colleagues established the modern understanding of palsa formation through detailed field studies in northern Fennoscandia in the 1960s and 1970s. Palsa initiation requires a combination of long, cold winters with thin snow cover (so that frost can penetrate deeply into the saturated peat), summer conditions cool enough that the frozen core does not fully thaw, and a peat surface dry enough that its low summer thermal conductivity insulates the underlying frozen ground from solar heating.12 Palsas grow upward by the addition of segregated ice lenses to their cores until they reach a height at which the dry, exposed peat cap insulates the body sufficiently to maintain it in equilibrium. Palsa fields are among the most climatically sensitive permafrost landforms on Earth, and their disappearance from many sites in northern Sweden, Finland, and northern Quebec since the late twentieth century has been documented as one of the most visible signatures of regional climate warming.
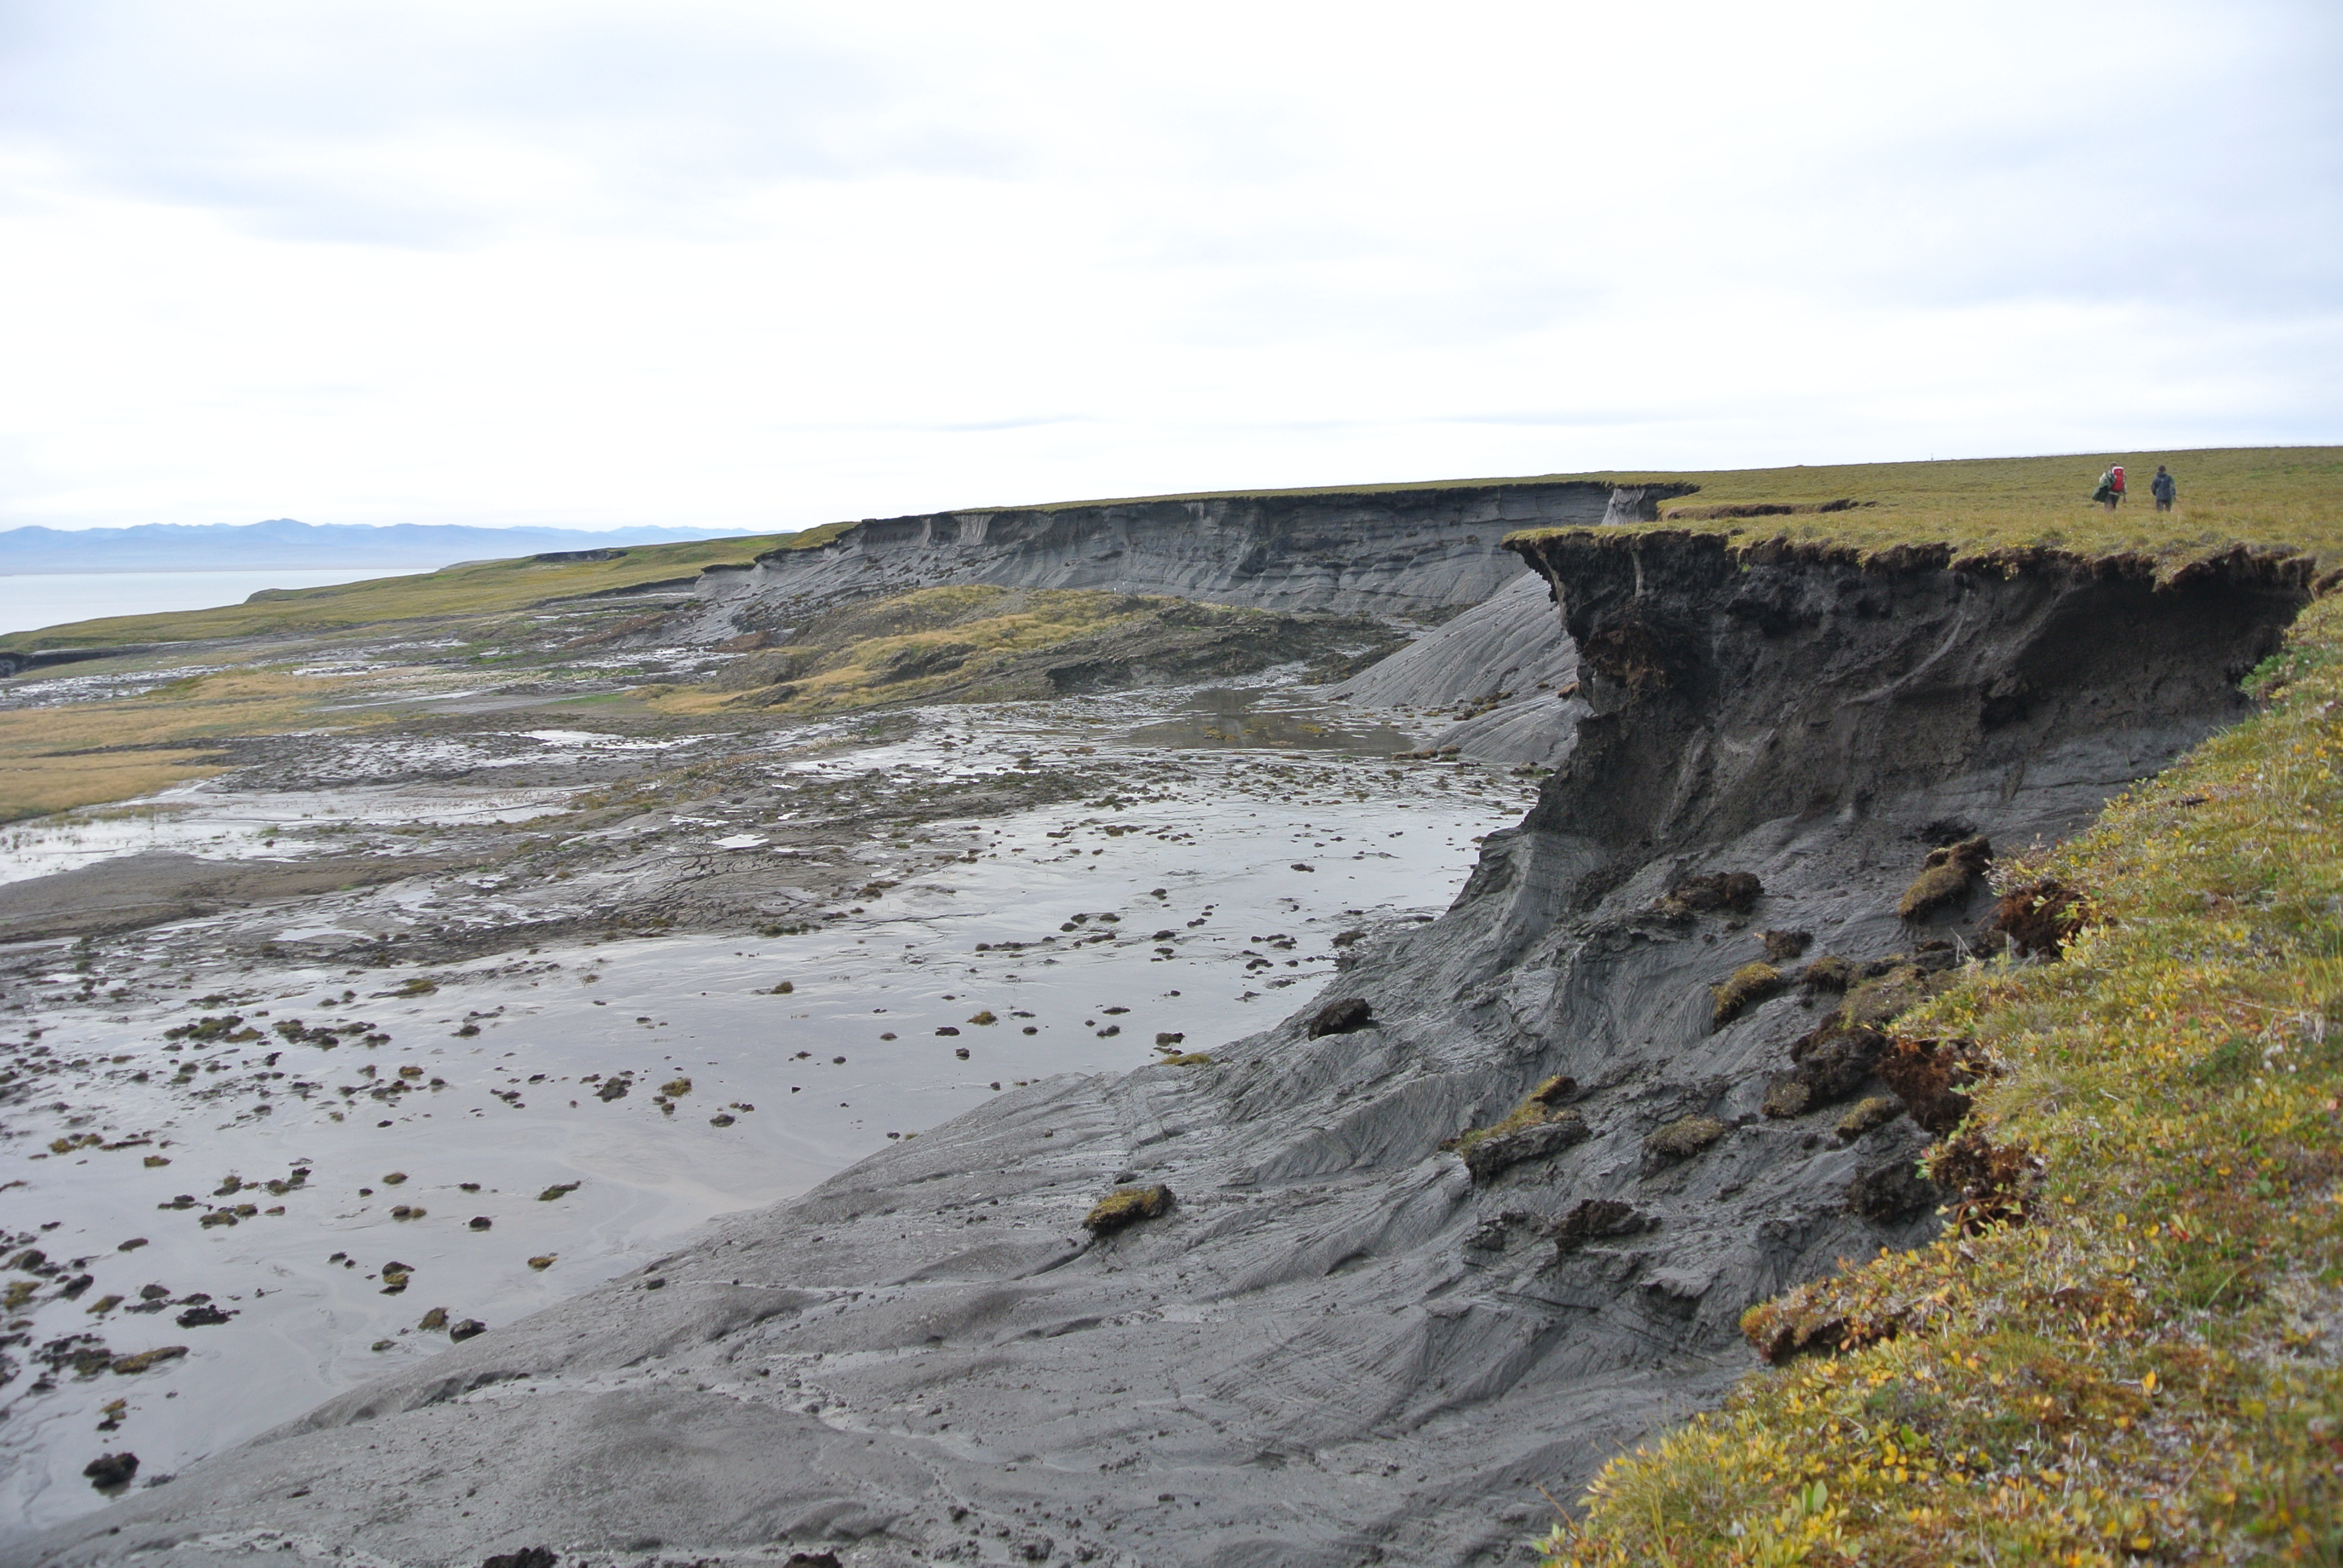
Thermokarst is the collective term for the irregular, hummocky, lake-pocked terrain that develops where ice-rich permafrost thaws and the volume previously occupied by ground ice collapses. The process is named by analogy to the karst topography that develops by dissolution of soluble rock, although the mechanism is entirely different: thermokarst involves no chemical action, only the melting of subsurface ice and the gravitational subsidence of the overlying material. Thermokarst features include shallow depressions called alases (a Yakut word for the broad, grass-floored thermokarst basins of central Siberia), elongate gullies and beaded streams, retrogressive thaw slumps where massive ice exposed on a slope retreats headward as it melts, and the iconic oriented thermokarst lakes of the Arctic Coastal Plain of Alaska, which form when shallow surface depressions become water-filled, accelerate the thaw of underlying ice-rich permafrost, and grow into elliptical lakes whose long axes align with the prevailing summer winds.15, 21 Recent satellite analyses across the pan-Arctic have documented widespread degradation of ice wedges and the conversion of low-centred polygonal terrain into high-centred polygons and thermokarst troughs over the past several decades, a transformation that alters surface hydrology, drainage networks, and the redistribution of soil moisture across enormous areas of tundra.23
Yedoma and the Pleistocene ice complex
The most spectacular and carbon-rich type of permafrost on Earth is the Yedoma Ice Complex, a late Pleistocene deposit of ice-rich, organic-bearing silt that covers approximately 1.4 million square kilometres of unglaciated Beringia — the broad region that includes northern Siberia, Alaska, and the Yukon Territory and that remained free of continental ice sheets during the last glacial period.9, 25 Yedoma deposits typically reach 20 to 50 metres in thickness and contain enormous syngenetic ice wedges — wedges that grew upward in step with the simultaneous deposition of windblown silt and the burial of organic material at the surface — that can be 5 metres wide and extend through the entire vertical column of the deposit.
The Yedoma deposits accumulated between approximately 60,000 and 12,500 years ago, during the Marine Isotope Stage 3 interstadial and the cold climate of the Last Glacial Maximum, when the unglaciated lowlands of Beringia experienced cold, dry, dusty conditions and intermittent productive grasslands populated by mammoth, woolly rhinoceros, bison, horse, and other megafauna whose bones and ivory are routinely recovered from eroding Yedoma cliffs.20 The combination of rapid sediment burial — primarily through aeolian deposition supplemented by alluvial and slope processes — with continuous incorporation of organic matter from the vegetation cover and with simultaneous cryogenic processes meant that organic carbon was rapidly entombed in permafrost without time for significant decomposition. The result is a deposit with mean total organic carbon content of approximately 3 percent for unaltered Yedoma and approximately 6.5 percent for thermokarst deposits derived from previously frozen Yedoma material that has subsequently thawed and refrozen.9
Strauss and colleagues estimated in 2013 that the entire Yedoma region holds approximately 211 (with substantial uncertainty bounds of approximately 60 to 370) petagrams of organic carbon — comparable to the total carbon content of all living vegetation in the world's tropical forests.9 Because Yedoma is so ice-rich, its degradation under warming temperatures produces particularly dramatic landscape change: as ice wedges melt and the silt collapses, vast thermokarst basins (alases) form, lakes develop, and the previously frozen organic matter becomes available for microbial decomposition. The Yedoma carbon pool is thus considered one of the most vulnerable components of the global permafrost carbon reservoir, and its fate is central to projections of the permafrost carbon feedback over the coming centuries.
The permafrost carbon reservoir
The total amount of organic carbon stored in the northern circumpolar permafrost region was first systematically quantified in the early twenty-first century, and successive synthesis efforts have converged on an estimate of approximately 1,300 petagrams of soil carbon in the upper three metres of the permafrost zone, plus the deeper Yedoma and river-delta carbon pools.7, 8 Hugelius and colleagues, in their 2014 synthesis published in Biogeosciences, derived a central estimate of 1,307 petagrams of carbon for the northern permafrost region from 0 to 3 metres depth, with an uncertainty range of approximately 1,140 to 1,476 petagrams. Approximately 800 of these 1,300 petagrams are perennially frozen — an amount equivalent to the entire carbon content of the present atmosphere.8
This reservoir is enormous in comparison with other terrestrial carbon pools. The total carbon contained in all the world's living vegetation is approximately 450 to 650 petagrams. The carbon in the atmosphere as CO2 is approximately 870 petagrams. Soil carbon outside the permafrost region totals roughly 2,000 to 2,500 petagrams in the upper three metres. The northern permafrost region therefore contains a quantity of carbon comparable in magnitude to the entire non-permafrost soil carbon pool worldwide, despite covering only about 15 percent of the global land area — a consequence of the fact that frozen ground inhibits microbial decomposition and allows organic matter to accumulate over millennial timescales without the loss to respiration that limits soil carbon accumulation in temperate climates.
Major carbon reservoirs of the Earth surface system, in petagrams (1 Pg = 1015 g)7, 8
The chemical composition and decomposability of permafrost organic matter vary widely across the circumpolar region. Surface soils in the active layer and the upper permafrost contain relatively young organic matter from recent vegetation, dominated by polysaccharides and other labile compounds that decompose rapidly when thawed. Deeper Yedoma and ice-complex carbon contains older organic matter, with radiocarbon ages typically between 20,000 and 60,000 years, that is more variable in its decomposability: some Yedoma material decomposes with surprising speed when thawed and incubated in the laboratory, while other fractions are more recalcitrant.7, 9 The fraction of permafrost carbon that will ultimately be released as the ground warms, and the relative proportions of CO2 versus methane, are central uncertainties in projecting the magnitude of the permafrost carbon feedback.
Permafrost warming and the GTN-P record
The most comprehensive global analysis of permafrost temperature change is the synthesis published by Boris Biskaborn and colleagues in Nature Communications in 2019. Drawing on borehole temperature time series from the Global Terrestrial Network for Permafrost, the study examined data from 154 boreholes distributed across the Arctic, the Antarctic, and the high mountains, all measured at the depth of zero annual amplitude where seasonal temperature fluctuations have damped out and the ground temperature reflects the long-term mean. The analysis covered the reference decade 2007 to 2016, which began at the conclusion of the International Polar Year (2007–2009) when borehole instrumentation expanded substantially worldwide.5
Biskaborn et al. found that mean permafrost temperature globally increased by 0.29 ± 0.12°C over the reference decade. The warming was strongly stratified by regional climate. Continuous permafrost in the cold Arctic warmed by 0.39 ± 0.15°C, the largest increase, while warmer discontinuous permafrost in the southern fringes warmed by only 0.20 ± 0.10°C. Mountain permafrost warmed by 0.19 ± 0.05°C, and the small set of Antarctic boreholes recorded warming of 0.37 ± 0.10°C.5 The most extreme regional warming was observed in northern Siberia, where some boreholes recorded ground-temperature increases approaching 1°C over the decade.
The pattern of stronger warming in colder permafrost is initially counter-intuitive but reflects the latent heat physics of frozen ground. Permafrost close to 0°C is largely buffered against warming by the latent heat absorbed when ice melts: as energy enters the system, it is consumed by phase change rather than raising the temperature. Cold permafrost well below 0°C contains less unfrozen water, has a lower effective heat capacity, and therefore warms more rapidly in response to the same flux of energy. This thermal buffering means that permafrost approaching the melting point is not protected from warming — it is, in fact, in the process of thawing — but rather that warming is masked in temperature observations and instead manifests as ice loss within the frozen ground.6, 15
Permafrost warming during the reference decade 2007–20165
| Region / type | Number of boreholes | Mean warming | Notes |
|---|---|---|---|
| Continuous (cold) permafrost | 71 | +0.39 ± 0.15°C | Greatest absolute warming; latent-heat buffering minimal |
| Discontinuous permafrost | 40 | +0.20 ± 0.10°C | Warming partly masked by phase-change latent heat |
| Mountain permafrost | 28 | +0.19 ± 0.05°C | Includes European Alps, Tibetan Plateau, Andes |
| Antarctic permafrost | 15 | +0.37 ± 0.10°C | Warming dominated by Antarctic Peninsula sites |
| Global mean (all sites) | 154 | +0.29 ± 0.12°C | First instrumented global synthesis |
The Biskaborn synthesis was the first instrumented confirmation that permafrost is warming at a global scale, in step with the warming of Arctic surface air. Earlier syntheses by Romanovsky, Smith, and Christiansen during and after the International Polar Year had documented warming at individual sites and regional networks, but the 2019 study established the planetary signal with a coherent multi-network methodology.5, 6 Subsequent updates of the GTN-P record have confirmed the trend and extended it through the early 2020s, with the largest warming continuing to occur in the cold Siberian and Canadian High Arctic.
The permafrost carbon feedback
As permafrost warms and thaws, the organic matter previously preserved in frozen ground becomes available for microbial decomposition. Aerobic decomposition produces carbon dioxide; anaerobic decomposition in waterlogged soils, such as those of thermokarst lakes and saturated thaw bogs, produces methane. Both gases are returned to the atmosphere, where they reinforce the warming that drove the thaw in the first place. This self-reinforcing cycle is the permafrost carbon feedback, and its magnitude over the coming centuries is one of the central uncertainties in climate projection.7, 22
The 2015 Nature review by Edward Schuur and an international team of permafrost scientists provided the foundational synthesis of the feedback. Drawing on observations, laboratory incubations, and modelling, the authors concluded that current evidence points toward a gradual but prolonged release of CO2 and methane in a warming climate, rather than an abrupt catastrophic outgassing. Their best estimate was a cumulative release of approximately 92 (± 17) petagrams of carbon by 2100 under a high-emissions scenario, equivalent to roughly a decade of present anthropogenic CO2 emissions, with the great majority released as CO2 and a smaller but climatically significant fraction as methane.7
Crucially, the Schuur et al. analysis distinguished between gradual top-down thaw, in which the active layer slowly deepens by a few centimetres per decade, and abrupt thaw driven by the collapse of ice-rich features such as thermokarst lakes, retrogressive thaw slumps, and Yedoma cliffs. Top-down thaw is captured by virtually all current Earth system models, while abrupt thaw is poorly represented because it occurs at scales below the resolution of climate models. Subsequent work by Turetsky and colleagues, published in 2020, estimated that abrupt thaw could approximately double the cumulative permafrost carbon release projected for the twenty-first century compared with the gradual-thaw-only baseline, even though abrupt thaw affects only a small fraction (perhaps 5 percent) of the total permafrost area.21
The IPCC Sixth Assessment Report (AR6), published in 2021, provided the most authoritative recent projection of permafrost change. AR6 concluded that, even if global warming is limited to well below 2°C (the lower target of the Paris Agreement), approximately 25 percent of near-surface permafrost (defined as the upper three to four metres) will thaw by 2100. Under a high-emissions trajectory consistent with continued growth in fossil fuel use, approximately 70 percent of near-surface permafrost will be lost by 2100.19 AR6 further projected that the permafrost carbon release amounts to approximately 18 petagrams of carbon per degree of global warming above pre-industrial, with a wide uncertainty range of 3 to 41 petagrams per degree, accumulating to a release on the order of 240 petagrams of CO2-carbon over the twenty-first century in the highest-emissions scenarios. The IPCC characterised the confidence in the existence of the feedback as high while assigning low confidence to the precise timing and magnitude of carbon release.
Subsea permafrost and methane hydrates
Beneath the floors of the shallow Arctic seas, particularly the East Siberian Arctic Shelf, the Laptev Sea, and the Beaufort Sea, lies a quantity of permafrost that formed during the lower sea levels of the last glacial period. With sea level approximately 120 metres below its present position at the Last Glacial Maximum, the broad continental shelves of the western Arctic were exposed to the same intensely cold continental climate that froze the Yedoma uplands of Beringia. As sea levels rose during the Holocene transgression, these previously terrestrial permafrost surfaces were inundated by relatively warm seawater and have been slowly degrading for the past 7,000 to 10,000 years from above by the heat flux through the overlying water column and from below by the geothermal gradient.16, 17
The fate of subsea permafrost is of particular concern because of its association with methane hydrates — ice-like crystalline solids in which methane molecules are trapped within cages of water molecules — that are stable only within a narrow range of temperatures and pressures. Where intact permafrost extends from the seafloor downward into the underlying sediment column, it forms a cap that prevents methane from escaping upward into the water column and atmosphere. As the permafrost cap thins and develops perforations through ongoing degradation, methane stored in or beneath the underlying gas hydrate stability zone has the potential to migrate upward and reach the seafloor.16, 17
Natalia Shakhova and colleagues have documented widespread methane supersaturation in the bottom waters and surface waters of the East Siberian Arctic Shelf, with active venting of methane to the atmosphere observed at numerous sites. Drilling into the subsea permafrost in the near-shore zone of the East Siberian Shelf has indicated downward retreat of the permafrost table at rates of approximately 14 centimetres per year over the past three decades, substantially faster than would be expected from stable, post-Holocene equilibration alone, suggesting an acceleration linked to recent warming.17 Estimates of the present-day methane flux from the East Siberian Arctic Shelf to the atmosphere remain uncertain, with some studies suggesting fluxes on the order of several teragrams of methane per year and others arguing for much smaller values; the large discrepancies reflect the difficulty of representative sampling across vast and seasonally inaccessible shelf areas. Earth-system modelling indicates that on the inner and middle shelves, subsea permafrost is likely to survive for thousands of years even under aggressive warming, while the outer shelf may degrade more rapidly.
Vegetation, snow, and the surface energy balance
The thermal regime of permafrost terrain is regulated not only by the climate but also by the surface energy balance, which depends critically on vegetation cover, snow depth and timing, soil moisture, and the organic mat that overlies the mineral soil in most tundra and boreal landscapes. Understanding these surface controls is essential for predicting how permafrost responds to changing climate, because the same air temperature change can produce very different ground temperature responses depending on vegetation and snow conditions.24
Snow is the dominant control on winter ground temperature. A thick, early-arriving snow cover insulates the ground from the cold winter atmosphere and keeps ground temperatures elevated; a thin or late-arriving snow cover allows winter cold to penetrate deeply and produces colder ground. Climate models that project future Arctic conditions consistently indicate increased winter precipitation across much of the high latitudes, falling primarily as snow, which would tend to insulate the ground and partially compensate for the direct effect of warmer summers. The net result depends on the balance between summer warming, which deepens the active layer, and winter snow insulation, which protects the underlying permafrost.24
Vegetation modifies the surface energy balance in several ways. A dense moss and lichen layer is a powerful summer insulator that limits the penetration of solar heat into the ground; the loss of such a layer through fire, trampling, or vegetation change can produce dramatic deepening of the active layer. Tree cover affects the radiation balance, the snow distribution, and the surface roughness; the boreal expansion of shrubs into formerly tundra areas observed across much of the Arctic over recent decades has measurable thermal consequences for the underlying ground. Soil moisture controls the thermal conductivity of the active layer and the latent heat that must be supplied to thaw it. Wildfire, increasingly frequent across the boreal and tundra biomes as the Arctic warms, can remove the insulating organic mat in a single event and accelerate active layer deepening for decades afterward.15, 24
Infrastructure, communities, and the human dimension
Approximately 5 million people live in the permafrost region of the Northern Hemisphere, including the populations of large industrial cities such as Yakutsk, Norilsk, and Vorkuta in Russia, as well as smaller communities scattered across the Canadian, Alaskan, and Nordic Arctic. The infrastructure that supports these populations — buildings, roads, airports, pipelines, railways, water and waste systems — was, in most cases, designed and constructed under the assumption that the underlying permafrost would remain stable indefinitely. The standard engineering practice in continuous permafrost terrain has long been to keep the ground frozen by building on insulated piles that lift structures above the surface, allowing air to circulate beneath them and prevent heat transfer to the active layer. Where the permafrost has remained cold, these techniques have served well for decades.18
The warming and degradation of permafrost has begun to compromise this infrastructure across the Arctic. As ice-rich ground thaws, it loses volume and mechanical strength: differential subsidence under buildings and roads produces cracking, tilting, and structural failure. The 2018 study by Jan Hjort and colleagues, published in Nature Communications, used circumpolar permafrost models combined with infrastructure inventories to project the area at risk by mid-century. Their analysis found that approximately 4 million people and 70 percent of current infrastructure in the permafrost domain are located in areas with high potential for near-surface permafrost thaw, and that one third of pan-Arctic infrastructure and 45 percent of the hydrocarbon extraction fields in the Russian Arctic lie in regions where thaw-related ground instability could cause severe damage to the built environment.18 These projections are not substantially altered by limiting global warming to the Paris Agreement targets, because much of the infrastructure is built on terrain whose permafrost is already close to the thaw point.
Specific high-profile incidents have begun to make the abstract risk visible. In May 2020, a fuel storage tank at a power station near Norilsk in northern Siberia collapsed and released 21,000 tonnes of diesel fuel into the surrounding rivers and tundra; investigators concluded that the failure of pile foundations bearing on thawing permafrost was a primary cause. Roads and runways across the Alaskan and Canadian north are increasingly affected by thaw-induced subsidence, with maintenance costs rising and some routes requiring complete reconstruction. The Trans-Alaska Pipeline System, designed in the 1970s with extensive provisions for frozen ground (including refrigerated heat pipes to preserve the permafrost beneath certain support pylons), continues to face engineering challenges as the underlying ground warms.18 For Indigenous Arctic communities whose traditional lifeways depend on stable terrain for hunting trails, cellars dug into permafrost for food storage, and predictable river ice and snow conditions, the rapid and accelerating change in permafrost is a profound transformation of the physical world in which their cultures developed.
Permafrost in the Earth system
Permafrost stands at the intersection of geology, climatology, hydrology, biology, and human geography, and its scientific study has matured from a regional curiosity into a central element of Earth system science. The integration of borehole thermometry, satellite remote sensing, modelling, and field observation has established permafrost as a quantitative component of the global carbon cycle, the cryosphere, and the regional climate system. The frozen ground beneath one-sixth of the Northern Hemisphere is not a passive accumulation of cold rock but a dynamic, ice-bonded substrate that records past climates in its temperature profile, hosts an enormous reservoir of preserved organic matter, and exerts strong feedbacks on the modern climate as it warms.1, 7
The permafrost record also offers a unique window onto the Pleistocene world. The ice complexes of Beringia preserve seeds, leaves, insects, vertebrate carcasses, and microbial communities that were entombed in frozen ground tens of thousands of years ago and remain in some cases extraordinarily well preserved. Whole woolly mammoths, mummified horses, and Pleistocene cave lions have been recovered from eroding Yedoma cliffs in Yakutia, and the genetic material extracted from these specimens has revolutionised the study of late Pleistocene fauna. The microbiology of ancient permafrost includes viable bacteria and protists that have survived for hundreds of thousands of years in the frozen state, providing some of the longest documented cases of biological survival under cryopreservation in the natural world.1, 20
For the next century, permafrost is likely to remain one of the most closely watched components of the cryosphere. Its response to ongoing warming will determine, in part, whether the climate system follows a relatively smooth trajectory through the targets of the Paris Agreement or whether feedbacks from the high latitudes accelerate change beyond what current emissions scenarios anticipate. The expansion of monitoring networks, the development of higher-resolution remote sensing of ground subsidence and thermokarst, the explicit representation of abrupt thaw in Earth system models, and the integration of permafrost considerations into engineering practice and Arctic policy together constitute one of the most active interdisciplinary research frontiers in the physical sciences. Whatever the ultimate magnitude of the permafrost carbon feedback, the perennially frozen ground of the high latitudes is being transformed at a rate without precedent in the instrumental record, and the consequences of that transformation are now visible in landscapes, ecosystems, and human communities across the circumpolar North.5, 18, 19
References
Northern Hemisphere permafrost map based on TTOP modelling for 2000–2016 at 1 km² scale
Permafrost thermal state in the polar Northern Hemisphere during the international polar year 2007–2009: a synthesis
Estimated stocks of circumpolar permafrost carbon with quantified uncertainty ranges and identified data gaps
Pingo growth and collapse, Tuktoyaktuk Peninsula area, western Arctic coast, Canada: a long-term field study
Spatial and temporal patterns of active layer thickness at Circumpolar Active Layer Monitoring (CALM) sites in northern Alaska, 1995–2000
The Circumpolar Active Layer Monitoring (CALM) program: research designs and initial results
Extensive methane venting to the atmosphere from sediments of the East Siberian Arctic Shelf
Current rates and mechanisms of subsea permafrost degradation in the East Siberian Arctic Shelf
IPCC, 2021: Climate Change 2021: The Physical Science Basis. Contribution of Working Group I to the Sixth Assessment Report of the Intergovernmental Panel on Climate Change
Late Quaternary ice-rich permafrost sequences as a paleoenvironmental archive for the Laptev Sea region in northern Siberia
Pan-Arctic ice-wedge degradation in warming permafrost and its influence on tundra hydrology
Reviews and syntheses: Changing ecosystem influences on soil thermal regimes in northern high-latitude permafrost regions