Overview
- Earth's climate is governed by the balance of incoming solar radiation and outgoing thermal radiation, modulated by the composition of the atmosphere, the circulation of the oceans, and feedback processes involving ice, water vapor, and clouds — a system whose sensitivity to perturbation has been demonstrated repeatedly across 4.5 billion years of geological history.
- Natural drivers of climate change include orbital variations that pace glacial cycles, volcanic eruptions that inject aerosols into the stratosphere, tectonic rearrangements that alter ocean circulation and the long-term carbon cycle, and solar luminosity changes — all of which are recorded in paleoclimate archives such as ice cores, ocean sediment cores, and tree rings.
- Since the mid-nineteenth century, the combustion of fossil fuels has increased atmospheric CO2 from approximately 280 to over 420 parts per million, a rate of change unprecedented in at least 800,000 years of ice core records, driving measurable increases in global mean surface temperature, sea level, and ocean acidity while reducing ice sheet mass and Arctic sea ice extent.
Climate change refers to sustained shifts in the statistical distribution of weather patterns — including temperature, precipitation, and wind — over periods ranging from decades to millions of years. Earth's climate has never been static. Over geological time, the planet has oscillated between hothouse states with no polar ice and icehouse states with continental-scale glaciation, driven by changes in atmospheric composition, orbital geometry, solar output, ocean circulation, and the arrangement of continents.8 The scientific understanding of climate change rests on nearly two centuries of physics, beginning with Joseph Fourier's recognition that the atmosphere traps heat, and extends through modern computational models that simulate the coupled interactions of atmosphere, oceans, ice, and biosphere.1, 9
Earth's climate system
Earth's climate is governed by the balance between incoming shortwave solar radiation and outgoing longwave thermal radiation. Approximately 340 watts per square meter of solar energy reach the top of the atmosphere on average; roughly 30 percent is reflected back to space by clouds, aerosols, and the surface (the planetary albedo), and the remaining 70 percent is absorbed by the atmosphere and surface, warming the planet.8 The absorbed energy is re-emitted as infrared radiation, but certain atmospheric gases — principally water vapor, carbon dioxide, methane, nitrous oxide, and ozone — absorb and re-emit a portion of this outgoing radiation, warming the surface above what its temperature would be if the atmosphere were transparent to infrared light. This process, identified by Fourier in 1827, is the greenhouse effect.1
The climate system comprises five interacting components: the atmosphere, the hydrosphere (oceans, lakes, and rivers), the cryosphere (ice sheets, glaciers, sea ice, and permafrost), the lithosphere (land surface and its geology), and the biosphere. Energy and matter flow continuously among these reservoirs. The oceans, which absorb roughly 90 percent of the excess heat from anthropogenic warming, act as a thermal flywheel that moderates atmospheric temperature variability but delays the full expression of radiative forcing for decades to centuries.8 Ocean circulation, both wind-driven and thermohaline, redistributes heat from the tropics toward the poles and connects the surface to the deep ocean on timescales of centuries to millennia.8
Feedback processes amplify or dampen the climate system's response to external forcing. The ice-albedo feedback is a positive feedback: warming reduces ice and snow cover, darkening the surface, which absorbs more solar radiation and causes further warming. The water vapor feedback is another powerful amplifier: a warmer atmosphere holds more water vapor, itself a greenhouse gas, which enhances the initial warming. Cloud feedbacks can be either positive or negative depending on cloud type, altitude, and optical properties, and remain the largest source of uncertainty in quantifying climate sensitivity.8, 19
The response time of the climate system varies enormously among its components. The atmosphere adjusts to radiative perturbations within weeks, the ocean mixed layer over years to decades, and the deep ocean over centuries to millennia. Ice sheets respond over centuries to tens of thousands of years. This hierarchy of timescales means that the full consequences of a change in radiative forcing — from a volcanic eruption, a shift in orbital parameters, or an increase in greenhouse gas concentrations — are realized only gradually, and the climate system may remain out of equilibrium for centuries after a perturbation ceases.8
The carbon cycle
Carbon cycles through the Earth system on two fundamentally different timescales. The short-term biological carbon cycle operates over years to millennia and involves the exchange of carbon among the atmosphere, oceans, soils, and living organisms. Photosynthesis draws CO2 from the atmosphere and fixes it into organic matter; respiration, decomposition, and combustion return it. The oceans exchange CO2 with the atmosphere across the air-sea interface, with cold high-latitude waters absorbing CO2 (the solubility pump) and biological productivity in surface waters drawing it down further (the biological pump).8
The long-term geological carbon cycle operates over millions to hundreds of millions of years and involves the exchange of carbon between the atmosphere and the solid Earth through volcanism, chemical weathering, and the burial of organic carbon and carbonate sediments. Volcanic and metamorphic degassing releases CO2 from the mantle and from carbonate rocks recycled through subduction zones. Chemical weathering of silicate rocks on land consumes CO2 and delivers dissolved bicarbonate to the oceans, where it is eventually precipitated as calcium carbonate in marine sediments. This silicate weathering thermostat acts as a negative feedback that stabilizes climate over geological time: warmer temperatures accelerate weathering and CO2 drawdown, while cooler temperatures slow it.8, 14 Tectonic processes set the pace of this cycle by controlling volcanic CO2 output and the exposure of weatherable rock. Major mountain-building episodes such as the Himalayan orogeny have been linked to long-term declines in atmospheric CO2 and global cooling over tens of millions of years.14
Natural drivers of climate change
Multiple natural processes force climate change on timescales ranging from years to hundreds of millions of years. On the longest timescales, tectonic reconfiguration of continents alters ocean circulation, volcanic CO2 outgassing rates, and the distribution of weatherable rock, producing slow shifts between hothouse and icehouse states. The Great Oxygenation Event approximately 2.4 billion years ago destroyed a methane greenhouse and may have triggered Paleoproterozoic glaciations, while the Snowball Earth episodes of the Neoproterozoic brought ice to equatorial latitudes before volcanic CO2 accumulation drove deglaciation.8
On timescales of tens to hundreds of thousands of years, Milankovitch cycles — periodic variations in Earth's orbital eccentricity (~100 ka), axial obliquity (~41 ka), and precession (~21 ka) — redistribute solar energy across latitude and season, pacing the glacial-interglacial cycles of the Quaternary. The landmark 1976 paper by Hays, Imbrie, and Shackleton demonstrated that the oxygen isotope record in deep-sea sediment cores contains spectral power at exactly the orbital frequencies, confirming that orbital geometry is the pacemaker of the ice ages.7 However, the orbital forcing alone is too small to account for the full amplitude of glacial-interglacial temperature swings; greenhouse gas feedbacks, ice-albedo feedbacks, and ocean circulation changes amplify the orbital signal into the 4–7 degrees Celsius global mean temperature changes observed between glacial and interglacial states.11
Volcanic eruptions inject sulfur dioxide into the stratosphere, where it converts to sulfate aerosols that reflect incoming solar radiation and cool the surface. Large eruptions such as Tambora (1815) and Pinatubo (1991) produced measurable global cooling of 0.1–0.5 degrees Celsius lasting one to three years.8 Changes in solar luminosity, though small over the instrumental record (approximately 0.1 percent variation over the 11-year solar cycle), have contributed to climate variability on longer timescales. Total solar irradiance has increased approximately 30 percent over the 4.56-billion-year life of the Sun, and the resolution of the faint young Sun problem — how Earth maintained liquid water despite lower solar luminosity — likely involves higher concentrations of greenhouse gases in the early atmosphere.8
Discovery of the greenhouse effect
The physical understanding of how the atmosphere warms the surface began with Joseph Fourier, who argued in 1827 that the atmosphere acts as an insulating layer, allowing solar radiation to reach the surface while impeding the escape of thermal radiation back to space.1 Fourier recognized that without this atmospheric effect, Earth's surface would be far colder than observed, though he did not identify which atmospheric constituents were responsible.
The experimental identification of the responsible gases came from John Tyndall, who in 1861 measured the infrared absorption of various gases in his laboratory at the Royal Institution. Tyndall demonstrated that water vapor and carbon dioxide are strong absorbers of thermal radiation, while the principal atmospheric constituents nitrogen and oxygen are essentially transparent to it. He recognized the climatic implications immediately, noting that changes in the concentration of these radiatively active gases could alter the temperature of the planet.2
Svante Arrhenius, in 1896, published the first quantitative estimate of how changes in atmospheric CO2 would affect global temperature. Using radiation balance calculations across latitude bands, Arrhenius estimated that a doubling of atmospheric CO2 would raise the global mean temperature by approximately 5 to 6 degrees Celsius — a value that, while higher than modern best estimates, was remarkably prescient for a first calculation performed without electronic computers.3 Arrhenius was motivated by the question of what caused the ice ages and proposed that variations in atmospheric CO2, driven by changes in volcanic outgassing and silicate weathering, could explain the glacial-interglacial oscillations that geologists had recently documented in the rock record.3
For the first half of the twentieth century, the greenhouse warming hypothesis received relatively little scientific attention, in part because many researchers believed the infrared absorption bands of CO2 were already saturated and that additional CO2 could not increase absorption further. This argument was overturned in the 1950s and 1960s when more careful spectroscopic and radiative transfer analyses demonstrated that the absorption depends on the pressure-broadened line structure of the CO2 spectrum and that increased concentrations do produce additional radiative forcing, particularly in the upper atmosphere where the air is thin and the absorption bands are not saturated.9 This revised understanding set the stage for Manabe and Wetherald's 1967 radiative-convective model, which placed the climate sensitivity to CO2 doubling on a firm quantitative footing for the first time.9
Paleoclimate evidence
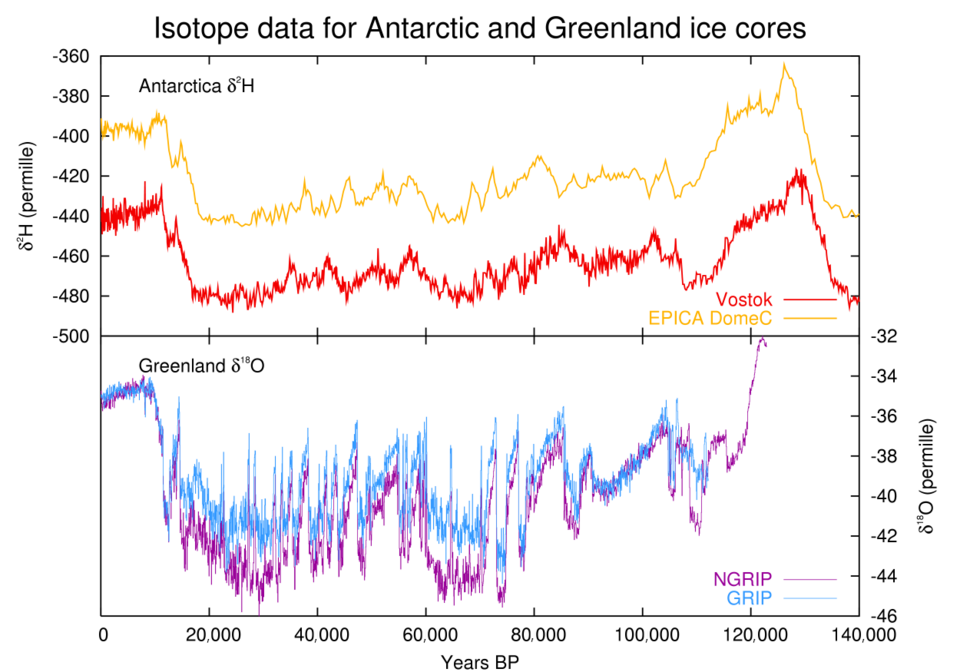
The reconstruction of past climates draws on multiple independent archives, each with different temporal resolution and reach. Ice cores drilled from the Antarctic and Greenland ice sheets provide the most direct records of past atmospheric composition, because tiny air bubbles trapped during snow compaction preserve actual samples of ancient atmospheres. The EPICA Dome C core extends the continuous atmospheric record to 800,000 years, revealing that CO2 oscillated between approximately 180 parts per million during glacial maxima and 280 parts per million during interglacials, in close parallel with Antarctic temperature.5, 18 At no point in this 800,000-year record did CO2 exceed 300 parts per million prior to the industrial era.18
Ocean sediment cores provide climate records extending back tens of millions of years. The oxygen isotope ratio (δ18O) of foraminifera shells preserved in marine sediments reflects both the temperature of the water in which they grew and the global volume of ice on land (because ice sheets preferentially lock up the lighter oxygen-16 isotope, enriching seawater in oxygen-18). The benthic foraminifera δ18O stack compiled by Lisiecki and Raymo traces the Quaternary glacial-interglacial cycles in detail and has been used to calibrate orbital forcing models.7 Deeper in time, ocean sediment records document the long-term cooling trend from the Eocene hothouse through the Oligocene glaciation of Antarctica and into the Pleistocene ice ages, driven in part by declining atmospheric CO2.14
Tree-ring records (dendroclimatology) provide annually resolved temperature and precipitation reconstructions spanning centuries to millennia. Combined with historical documents, coral growth bands, cave speleothems, and lake sediments, these proxies have been used to reconstruct Northern Hemisphere temperature variability over the past one to two thousand years. The reconstruction by Mann, Bradley, and Hughes showed that late-twentieth-century warming was anomalous in the context of the previous millennium, with temperatures rising sharply after centuries of relative stability or gradual cooling.17
Major paleoclimate archives and their temporal range5, 7, 17
| Archive | Maximum time span | Resolution | Key proxies |
|---|---|---|---|
| Antarctic ice cores | ~800,000 years | Decadal to centennial | δ18O, δD, trapped CO2/CH4, dust |
| Greenland ice cores | ~130,000 years | Annual to sub-decadal | δ18O, accumulation rate, chemistry |
| Deep-sea sediment cores | >100 million years | Millennial | Foraminifera δ18O, Mg/Ca, alkenones |
| Tree rings | ~12,000 years | Annual | Ring width, density, δ13C |
| Speleothems | ~600,000 years | Sub-decadal to centennial | δ18O, trace elements, growth rate |
| Corals | ~500 years (living); longer from fossil corals | Monthly to annual | δ18O, Sr/Ca, growth bands |
Anthropogenic climate change
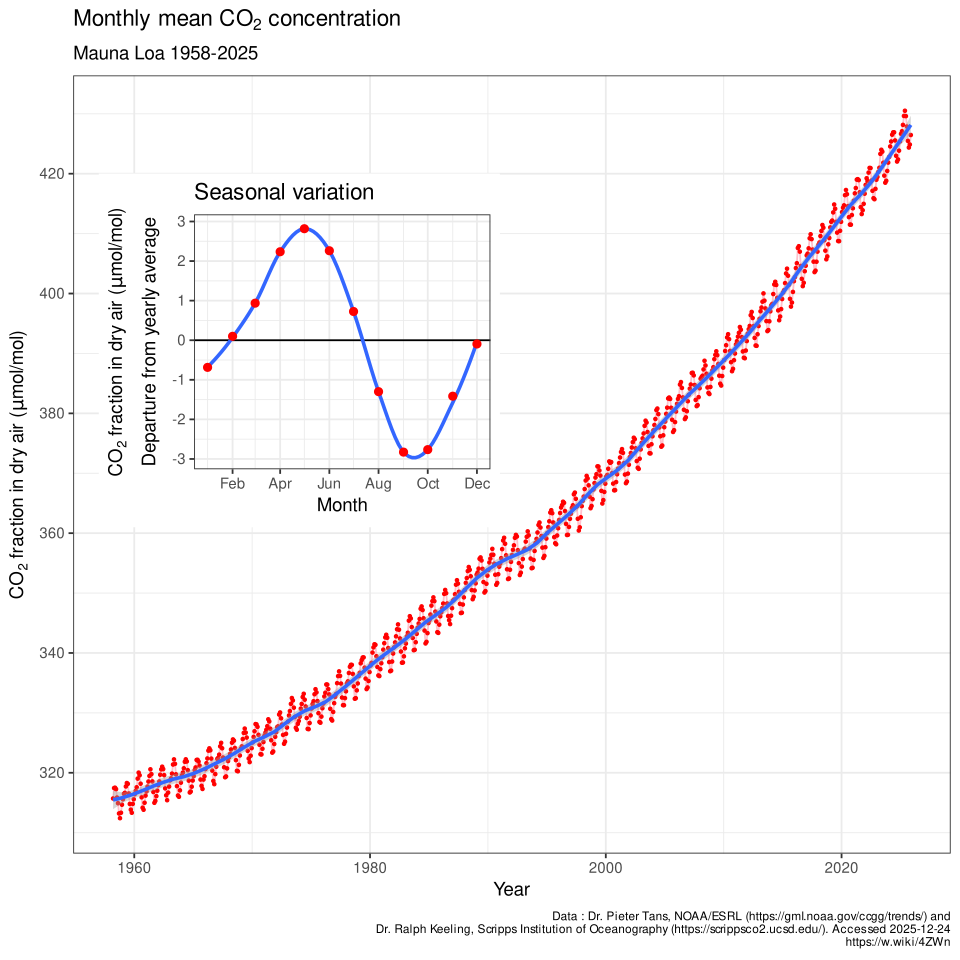
The systematic monitoring of atmospheric CO2 began in 1958 when Charles David Keeling installed an infrared gas analyzer at the Mauna Loa Observatory in Hawaii. His measurements revealed two superimposed signals: a seasonal cycle driven by the photosynthetic uptake and respiratory release of CO2 by Northern Hemisphere vegetation, and a relentless year-over-year increase driven by the combustion of fossil fuels and, to a lesser extent, deforestation and cement production. The annual mean concentration stood at approximately 316 parts per million in 1959; by 2024 it had exceeded 420 parts per million.4, 8 This upward trend, known as the Keeling curve, is one of the most important geophysical datasets of the twentieth century.
The attribution of the observed CO2 increase to fossil fuel combustion is established by multiple independent lines of evidence. The carbon isotopic composition (δ13C) of atmospheric CO2 has become progressively more negative over the industrial era, consistent with the addition of isotopically light carbon from fossil organic matter. The simultaneous decline in atmospheric oxygen concentration (the O2/N2 ratio) matches the stoichiometry of hydrocarbon combustion. And the rate of CO2 increase closely tracks the known history of fossil fuel emissions, with approximately 45 percent of cumulative emissions remaining in the atmosphere and the rest absorbed by the oceans and terrestrial biosphere.8
The theoretical foundation for predicting the climate response to increased CO2 was laid by Syukuro Manabe and Richard Wetherald in 1967, who developed the first radiative-convective model of the atmosphere and predicted that a doubling of CO2 would warm the surface by approximately 2 degrees Celsius, with amplification by the water vapor feedback.9 James Hansen and colleagues at NASA extended this work in 1981, using increasingly sophisticated general circulation models to predict that anthropogenic greenhouse warming would exceed natural climate variability by the end of the twentieth century and that the signal would be most pronounced at high latitudes.10
Observed changes
The global mean surface temperature has increased by approximately 1.1 degrees Celsius above the 1850–1900 average as of the early 2020s, according to multiple independent surface temperature datasets. The warming is not uniform: Arctic regions have warmed at more than twice the global average (a phenomenon called Arctic amplification), land surfaces have warmed faster than ocean surfaces, and nighttime minimum temperatures have risen faster than daytime maxima.8 Each of the four decades from 1980 to 2020 has been successively warmer than any preceding decade in the instrumental record, which begins in the mid-nineteenth century.8
Global mean sea level rose by approximately 20 centimeters over the twentieth century, with the rate accelerating from approximately 1.3 millimeters per year over the full century to approximately 3.7 millimeters per year in the 2006–2018 period.8, 12 The acceleration reflects increasing contributions from the thermal expansion of ocean water, the melting of mountain glaciers, and the mass loss of the Greenland and Antarctic ice sheets. The Greenland Ice Sheet lost approximately 3,800 gigatonnes of ice between 1992 and 2018, contributing approximately 10.6 millimeters to global sea level rise, with the rate of loss increasing sixfold over that interval.16 The Antarctic Ice Sheet lost approximately 2,720 gigatonnes over 1992–2017, with most of the loss concentrated in the West Antarctic Ice Sheet and the Antarctic Peninsula.20
Arctic sea ice extent has declined in all months of the year since satellite observations began in 1979, with the September minimum declining at a rate of approximately 13 percent per decade relative to the 1981–2010 average. The loss of Arctic sea ice reduces surface albedo and contributes to Arctic amplification, a positive feedback that helps explain why the Arctic has warmed at more than twice the global average rate. Mountain glaciers worldwide have retreated substantially, with global glacier mass loss accelerating from approximately 220 gigatonnes per year in the 2000–2009 period to approximately 290 gigatonnes per year in the 2010–2019 period.8
The oceans have absorbed approximately 30 percent of the anthropogenic CO2 emitted since the preindustrial era, which has measurably altered ocean chemistry. The dissolved CO2 reacts with seawater to form carbonic acid, lowering pH — a process called ocean acidification. Surface ocean pH has declined by approximately 0.1 units since preindustrial times, corresponding to a roughly 26 percent increase in hydrogen ion concentration. Caldeira and Wickett projected in 2003 that continued emissions at business-as-usual rates could produce ocean pH changes larger than any experienced in at least 300 million years.13 Ocean acidification threatens calcifying organisms, including corals, mollusks, and certain plankton, by reducing the saturation state of calcium carbonate minerals from which they build shells and skeletons.8, 13
CO2–temperature coupling in the geological record
The ice core record demonstrates that atmospheric CO2 and global temperature have co-varied across every glacial-interglacial cycle of the past 800,000 years, with CO2 acting as both a response to and an amplifier of orbitally forced climate change.5, 6 During glacial terminations, the initial warming signal appears first in Antarctic temperature records, driven by changes in orbital geometry and their effect on Southern Hemisphere insolation. Within centuries, CO2 begins to rise as warming oceans release dissolved CO2 and changes in ocean circulation bring carbon-rich deep water to the surface. The rising CO2 then drives additional warming globally, and the global mean temperature increase lags the CO2 rise rather than preceding it.11
This phasing demonstrates that CO2 functions as an essential amplifying feedback in the climate system. Orbital forcing alone changes the distribution of solar energy across latitude and season but does not significantly alter the total energy received by Earth; the full 4–7 degrees Celsius glacial-interglacial temperature swing requires the amplification provided by changes in greenhouse gases, ice albedo, vegetation, and dust.11, 6 The current anthropogenic increase in CO2 — from 280 to over 420 parts per million in approximately 170 years — has no analogue in the ice core record. The EPICA and Vostok cores show that natural CO2 changes of 80–100 parts per million occurred over 5,000 to 20,000 years during glacial terminations; the anthropogenic increase of 140 parts per million has occurred in less than two centuries.5, 15, 18
Climate sensitivity and projections
Climate sensitivity quantifies how much the global mean surface temperature changes in response to a sustained doubling of atmospheric CO2. Two measures are commonly used: the equilibrium climate sensitivity (ECS), defined as the long-term warming after the climate system has fully adjusted, and the transient climate response (TCR), the warming at the time of CO2 doubling under a scenario of gradual increase. The IPCC Sixth Assessment Report assessed the likely range of ECS at 2.5 to 4.0 degrees Celsius, with a best estimate of 3.0 degrees Celsius, based on the convergence of evidence from paleoclimate reconstructions, the observed warming record, process understanding, and climate model simulations.8
A comprehensive assessment by Sherwood and colleagues synthesized multiple lines of evidence — including the instrumental temperature record, volcanic cooling episodes, paleoclimate constraints from the Last Glacial Maximum and Pliocene warm periods, and cloud feedback observations — to constrain ECS to a range of 2.6 to 3.9 degrees Celsius at 66 percent confidence, effectively ruling out both the lowest and highest values that had appeared in earlier literature.19 Paleoclimate data are particularly valuable for constraining sensitivity because they provide examples of the climate system's response to large radiative perturbations. The approximately 5 degrees Celsius global cooling during the Last Glacial Maximum, driven by lower CO2, expanded ice sheets, and altered vegetation, is broadly consistent with an ECS near 3 degrees Celsius.11, 19
On longer timescales, Earth system sensitivity (ESS) — which includes slow feedbacks such as ice sheet dynamics, vegetation change, and permafrost carbon release that are not captured by ECS — may be substantially higher. Estimates from the warm Pliocene epoch, when CO2 concentrations were comparable to present-day levels and global temperatures were 2–3 degrees Celsius warmer, suggest ESS values 1.5 to 2 times larger than ECS.14 Projections of future warming depend not only on sensitivity but on the trajectory of greenhouse gas emissions. Under the highest-emission scenarios assessed in the IPCC Sixth Assessment Report, global mean surface temperature could rise by 3.3 to 5.7 degrees Celsius above preindustrial levels by 2100; under the lowest-emission scenarios, warming would be limited to 1.0 to 1.8 degrees Celsius.8
The relationship between cumulative CO2 emissions and global warming is approximately linear, a property known as the transient climate response to cumulative emissions (TCRE). The IPCC Sixth Assessment Report estimated the TCRE at 1.0 to 2.3 degrees Celsius per trillion tonnes of carbon emitted, with a best estimate of 1.65 degrees Celsius.8 This near-linear relationship implies that every additional tonne of CO2 emitted contributes approximately the same amount of warming, and that stabilizing global temperature at any level requires reaching net-zero CO2 emissions. The remaining carbon budget — the total amount of CO2 that can still be emitted while keeping warming below a specified threshold — follows directly from the TCRE and the chosen temperature target.8
Sea level projections illustrate the long-term commitment embedded in ice sheet response times. Even under aggressive emission reduction scenarios, global mean sea level is projected to continue rising throughout the twenty-first century due to the thermal inertia of the ocean and the slow response of ice sheets to warming already realized. Projections for 2100 range from 0.3 to 1.0 meters depending on the emission pathway, with higher values possible if ice sheet dynamics involve threshold processes such as marine ice sheet instability in West Antarctica.8, 12 On multi-century timescales, sustained warming of 2 to 3 degrees Celsius above preindustrial levels could eventually produce sea level rise of 2 to 6 meters from Greenland Ice Sheet loss alone, and the complete deglaciation of both Greenland and Antarctica would raise sea level by approximately 65 meters.16, 20
References
Climate and atmospheric history of the past 420,000 years from the Vostok ice core, Antarctica
Hays, Imbrie, and Shackleton: variations in the Earth's orbit: pacemaker of the ice ages
A reconstruction of atmospheric carbon dioxide and its stable carbon isotopic composition from the penultimate glacial maximum to the last glacial inception
High-resolution carbon dioxide concentration record 650,000–800,000 years before present