Overview
- Type Ia supernovae are thermonuclear explosions of carbon-oxygen white dwarfs that produce remarkably uniform peak luminosities, and the empirical Phillips relation between peak brightness and light-curve decline rate transforms them into standardizable candles capable of measuring distances across billions of light-years.
- Two independent teams—the Supernova Cosmology Project led by Saul Perlmutter and the High-z Supernova Search Team led by Brian Schmidt and Adam Riess—used Type Ia supernovae in 1998 to discover that the expansion of the universe is accelerating, a finding that implied the existence of dark energy and earned the 2011 Nobel Prize in Physics.
- The SH0ES program's Cepheid-calibrated Type Ia distance ladder yields a Hubble constant of 73.04 ± 1.04 km/s/Mpc, in 5σ tension with the Planck cosmic microwave background value of 67.4 ± 0.5 km/s/Mpc—a discrepancy confirmed by JWST observations and now one of the most actively contested problems in cosmology.
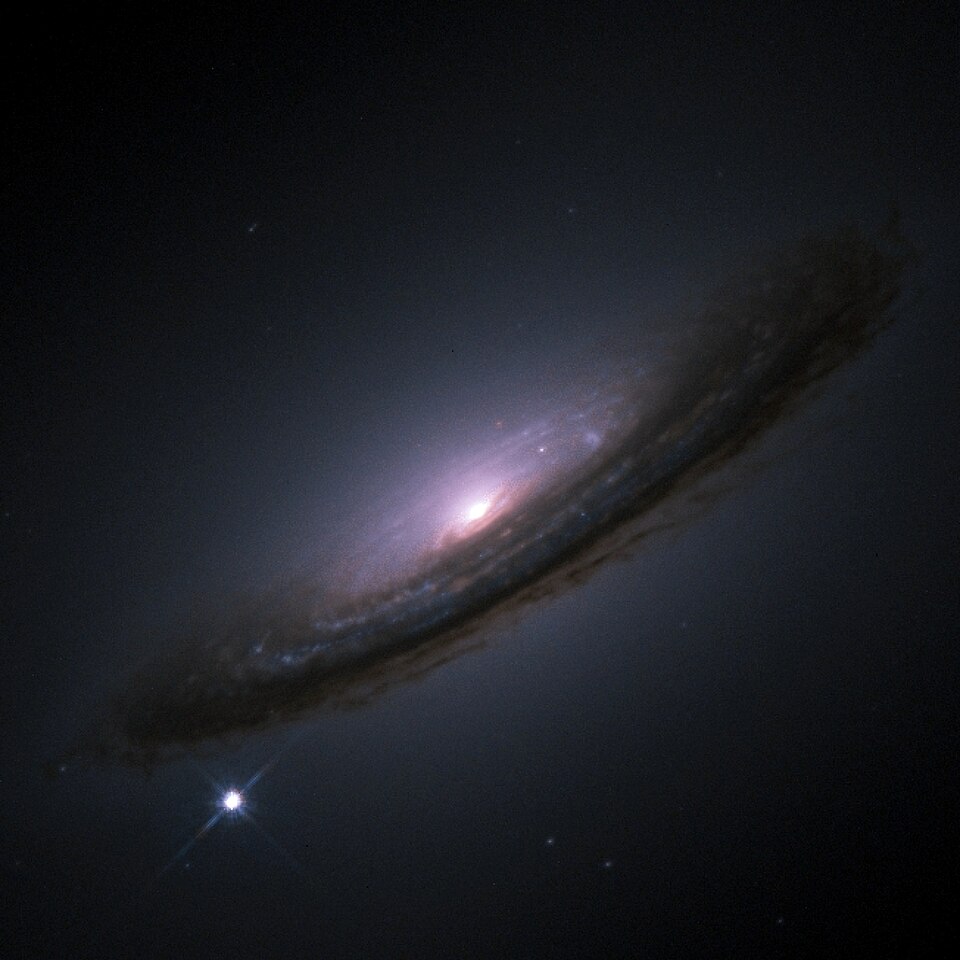
Type Ia supernovae are among the most luminous stellar explosions in the universe, briefly rivalling the light output of an entire galaxy and visible across billions of light-years. Because they arise from a physically constrained process — the thermonuclear detonation of a carbon-oxygen white dwarf approaching a critical mass limit — their peak luminosities are remarkably uniform, making them powerful distance indicators for cosmology.4 The discovery in 1993 that the residual scatter in their peak brightness correlates tightly with the rate at which their light curves decline transformed Type Ia supernovae from merely bright events into standardizable candles: objects whose intrinsic luminosity can be inferred from observable properties and compared with their apparent brightness to determine distance.2
The cosmological impact of this standardization was profound. In 1998, two independent teams used Type Ia supernovae at high redshift to make one of the most unexpected discoveries in the history of physics: the expansion of the universe is not decelerating under the gravitational pull of matter, as had been widely assumed, but is instead accelerating, driven by a mysterious component now called dark energy.8, 9 This discovery, honoured with the 2011 Nobel Prize in Physics, reshaped modern cosmology and placed Type Ia supernovae at the centre of ongoing efforts to measure the expansion history of the universe and determine the nature of dark energy.10
Physics of Type Ia supernovae
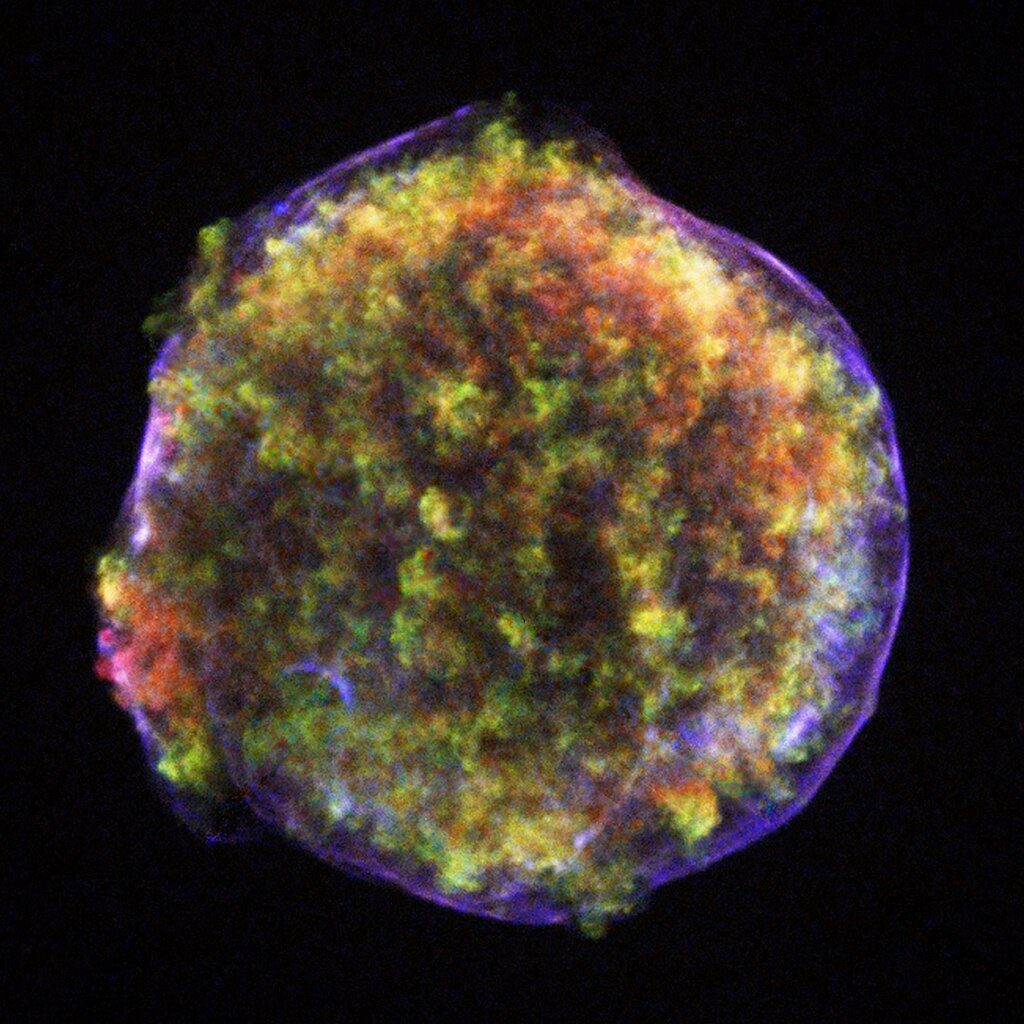
A Type Ia supernova is the thermonuclear explosion of a carbon-oxygen white dwarf in a binary star system. White dwarfs are the compact remnant cores of low- and intermediate-mass stars (those born with roughly 0.8 to 8 solar masses) that have exhausted their nuclear fuel and shed their outer envelopes. They are supported against gravitational collapse not by thermal pressure from ongoing fusion but by electron degeneracy pressure, the quantum-mechanical resistance of electrons to being compressed into identical energy states.1
In 1931, the Indian-American astrophysicist Subrahmanyan Chandrasekhar demonstrated that electron degeneracy pressure can support a white dwarf only up to a critical mass of approximately 1.4 solar masses, a value now known as the Chandrasekhar limit.1 If a white dwarf's mass approaches this threshold, its central density and temperature rise to the point where carbon and oxygen nuclei begin to fuse in a runaway thermonuclear reaction. Unlike main-sequence stars, which can expand and cool in response to increased energy production, the degenerate interior of a white dwarf cannot regulate the burning. The nuclear reactions accelerate catastrophically, releasing roughly 1 to 2 × 1051 ergs of energy in a matter of seconds and unbinding the entire star in a supernova explosion.4
The energy source that powers the weeks-long optical display of a Type Ia supernova is the radioactive decay chain of nickel-56, which is synthesised in large quantities during the explosion. Nickel-56 decays to cobalt-56 with a half-life of 6.1 days, and cobalt-56 subsequently decays to stable iron-56 with a half-life of 77.3 days. The gamma rays and positrons produced by these decays are thermalised in the expanding ejecta, heating it and producing the characteristic light curve.3 In 1982, W. David Arnett demonstrated that the peak bolometric luminosity of the supernova is approximately equal to the instantaneous rate of energy deposition from nickel-56 decay at the time of maximum light — a result known as Arnett's rule — establishing a direct link between the mass of nickel-56 produced and the supernova's peak brightness.3 Because the explosion mechanism is governed by a well-defined physical threshold (the Chandrasekhar mass), and because the luminosity at peak is set by the mass of nickel-56 synthesised, Type Ia supernovae produce a relatively narrow range of peak luminosities compared with other classes of stellar explosion.4
The Phillips relation and the standardizable candle
Despite the physical uniformity imposed by the Chandrasekhar limit, Type Ia supernovae are not perfect standard candles. Their peak absolute magnitudes exhibit an intrinsic scatter of roughly 0.8 magnitudes in the B band, corresponding to a factor of approximately two in luminosity.2 If left uncorrected, this scatter would limit their utility as precise distance indicators. The breakthrough that transformed Type Ia supernovae from approximate standard candles into high-precision distance tools came in 1993, when the Chilean-based astronomer Mark Phillips demonstrated a tight empirical correlation between a supernova's peak luminosity and the rate at which its light curve declines after maximum.2
Phillips quantified the decline rate using the parameter Δm15(B), defined as the number of magnitudes by which the supernova fades in the B band during the first 15 days after maximum light. He showed that intrinsically brighter Type Ia supernovae decline more slowly (smaller Δm15 values), while fainter events decline more rapidly (larger Δm15 values).2 This relationship, now universally known as the Phillips relation or the luminosity-decline rate relation, has a clear physical basis: supernovae that synthesise more nickel-56 are both brighter (because the peak luminosity tracks the nickel mass) and slower to fade (because the larger mass of radioactive material keeps the ejecta hotter and more opaque for longer).3, 4
The practical application of the Phillips relation was demonstrated compellingly by the Calan/Tololo Supernova Survey, a systematic search programme that discovered approximately 30 Type Ia supernovae at redshifts up to z ≈ 0.1 during the early 1990s. When the peak magnitudes of these supernovae were corrected for their decline rates, the scatter in the Hubble diagram was reduced to approximately 0.15 magnitudes, corresponding to distance uncertainties of only 7 to 10 percent — a precision sufficient for meaningful cosmological measurements.5
Subsequent refinements have improved the standardization further. In 1998, Robert Tripp showed that adding a second parameter — the supernova's colour at maximum light — to the decline-rate correction reduced the scatter even more, because redder supernovae (whether intrinsically red or reddened by intervening dust) are systematically fainter.6 Modern light-curve fitting algorithms such as SALT2 (Spectral Adaptive Lightcurve Template) model the supernova's spectral energy distribution as a function of time and parameterise each event by a stretch factor (related to the light-curve width) and a colour parameter, enabling standardized distance estimates with scatter as low as 0.10 to 0.15 magnitudes.7
The discovery of accelerating expansion
By the mid-1990s, the techniques for discovering, classifying, and standardizing Type Ia supernovae had matured to the point where they could be applied to events at cosmologically significant distances. Two rival teams undertook the ambitious programme of searching for Type Ia supernovae at high redshifts (z ≈ 0.3 to 0.8) in order to measure the deceleration of the cosmic expansion and, through it, the geometry and matter content of the universe.
.jpg)
The Supernova Cosmology Project, led by Saul Perlmutter at the Lawrence Berkeley National Laboratory, had been initiated in 1988 and by the late 1990s had assembled a sample of 42 high-redshift Type Ia supernovae.9 The High-z Supernova Search Team, led by Brian Schmidt at the Australian National University with Adam Riess of Johns Hopkins University playing a crucial analytical role, independently collected spectral and photometric observations of 10 high-redshift events in the range 0.16 ≤ z ≤ 0.62.8
Both teams expected to find that the expansion of the universe was slowing down, pulled back by the collective gravitational attraction of all the matter it contains. Instead, they found the opposite. The distant Type Ia supernovae were 10 to 15 percent fainter than expected in a matter-dominated, decelerating universe, implying that they were farther away than the standard cosmological models predicted.8 The only way to reconcile the observations with general relativity was to invoke a component of the universe with negative pressure — a repulsive effect that causes the expansion to accelerate rather than decelerate. The Riess et al. analysis, published in September 1998 in The Astronomical Journal, and the Perlmutter et al. analysis, published in June 1999 in The Astrophysical Journal, independently reached the same startling conclusion: the expansion of the universe is accelerating, implying the existence of what is now called dark energy.8, 9
The best-fit cosmology from both teams converged on a matter density of approximately one-third of the critical density (ΩM ≈ 0.3) and a vacuum energy density roughly twice as large (ΩΛ ≈ 0.7), implying that the universe is not only expanding but doing so at an ever-increasing rate.8, 9 The discovery was named the Breakthrough of the Year for 1998 by Science magazine, and in 2011 Perlmutter, Schmidt, and Riess were awarded the Nobel Prize in Physics "for the discovery of the accelerating expansion of the Universe through observations of distant supernovae."10
Calibrating the distance ladder
Type Ia supernovae do not yield absolute distances on their own. The Phillips relation and its modern refinements allow astronomers to determine the relative brightnesses — and therefore the relative distances — of different supernovae with high precision, but converting these relative distances into absolute ones requires an external calibration. This calibration is provided by the lower rungs of the cosmic distance ladder: a chain of overlapping distance-measurement techniques, each calibrated by the one below it.
The critical calibrating rung for Type Ia supernovae is the Cepheid period-luminosity relation, first established by Henrietta Swan Leavitt in 1912.22 Cepheid variable stars pulsate with periods that are tightly correlated with their intrinsic luminosities, making them excellent distance indicators out to roughly 40 megaparsecs. The calibration chain works as follows: geometric methods (stellar parallax from the Gaia spacecraft, eclipsing binaries in the Large Magellanic Cloud, and water-maser distances to the galaxy NGC 4258) anchor the absolute luminosities of Cepheids; Cepheids are then observed in the host galaxies of nearby Type Ia supernovae to calibrate the absolute peak brightness of those supernovae; and the calibrated supernova luminosity is applied to the full sample of Type Ia events extending to high redshift to measure the expansion history of the universe.13, 21
The SH0ES (Supernovae and H0 for the Equation of State of dark energy) programme, led by Adam Riess, has systematically refined this calibration chain over two decades. The 2022 SH0ES analysis used the Hubble Space Telescope to observe Cepheids in the host galaxies of 42 Type Ia supernovae, calibrated against geometric distance anchors from Gaia parallaxes, NGC 4258 masers, and Large Magellanic Cloud eclipsing binaries, producing the most precise local measurement of the Hubble constant to date: H0 = 73.04 ± 1.04 km/s/Mpc.13
The Hubble tension
The SH0ES measurement of H0 = 73.04 ± 1.04 km/s/Mpc is in sharp disagreement with the value inferred from observations of the cosmic microwave background (CMB) by the Planck satellite, which yields H0 = 67.4 ± 0.5 km/s/Mpc when analysed within the standard ΛCDM cosmological model.13, 14 The discrepancy between these two measurements, now exceeding 5 standard deviations, is known as the Hubble tension and represents one of the most actively contested problems in modern cosmology.
The significance of the tension lies in the fact that the two measurements probe fundamentally different epochs of cosmic history. The Planck CMB value is a prediction: it takes the physics of the early universe (380,000 years after the Big Bang) and extrapolates forward to the present day using the ΛCDM model, which assumes a flat universe with a cosmological constant, cold dark matter, and known particle physics. The SH0ES value is a direct measurement of the local expansion rate, anchored by Cepheids and Type Ia supernovae within the last few hundred million years. If both measurements are correct, the standard cosmological model may be incomplete, potentially requiring new physics such as early dark energy, additional relativistic species, or modifications to the equation of state of dark energy.13, 14
A critical question is whether systematic errors in the Cepheid-Type Ia distance ladder could account for the discrepancy. In 2024, Riess and collaborators published James Webb Space Telescope (JWST) observations of over 1,000 Cepheids in five Type Ia supernova host galaxies and in the anchor galaxy NGC 4258. The JWST's superior spatial resolution in the near-infrared allowed the team to resolve individual Cepheids that had been blended with neighbouring stars in Hubble images — a potential systematic known as crowding bias. The result was unambiguous: the JWST and Hubble distance measurements agreed to within 0.01 ± 0.03 magnitudes, rejecting crowding as an explanation for the Hubble tension at 8σ confidence.15
An alternative calibration pathway has been pursued by the Chicago-Carnegie Hubble Program (CCHP), led by Wendy Freedman. Rather than relying solely on Cepheids, the CCHP calibrates Type Ia supernovae using the tip of the red giant branch (TRGB) method and the J-region asymptotic giant branch (JAGB) method, both of which are less sensitive to dust and crowding than Cepheids. Preliminary JWST results from the CCHP yield Hubble constant values of approximately 68.8 ± 2.2 km/s/Mpc (TRGB) and 67.8 ± 2.7 km/s/Mpc (JAGB), closer to the Planck value, though with larger uncertainties than the SH0ES result.16 The disagreement between the CCHP and SH0ES results, both of which use Type Ia supernovae as the final rung but different intermediate calibrators, suggests that the resolution of the Hubble tension may hinge on understanding subtle systematics in the distance ladder's middle rungs.
Hubble constant measurements from different methods13, 14, 15, 16
| Method | H0 (km/s/Mpc) | Team / Source | Year |
|---|---|---|---|
| Cepheids → Type Ia SNe | 73.04 ± 1.04 | SH0ES (Riess et al.) | 2022 |
| CMB (ΛCDM prediction) | 67.4 ± 0.5 | Planck Collaboration | 2020 |
| TRGB → Type Ia SNe (JWST) | 68.8 ± 2.2 | CCHP (Freedman et al.) | 2024 |
| JAGB → Type Ia SNe (JWST) | 67.8 ± 2.7 | CCHP (Freedman et al.) | 2024 |
| Cepheids → Type Ia SNe (JWST confirmed) | 72.6 ± 2.0 | SH0ES (Riess et al., JWST) | 2024 |
Progenitor models
Despite their importance as cosmological distance indicators, the specific binary system configurations that give rise to Type Ia supernovae remain a subject of active debate. Two broad classes of progenitor models have been proposed, distinguished by the nature of the white dwarf's companion star.11
In the single-degenerate (SD) model, a carbon-oxygen white dwarf accretes hydrogen- or helium-rich material from a non-degenerate companion — typically a main-sequence star, a red giant, or a helium star. As the accreted material accumulates on the white dwarf's surface and is compressed, it undergoes nuclear burning that increases the white dwarf's mass toward the Chandrasekhar limit. When the central density and temperature become sufficient, carbon ignites in the core and the thermonuclear runaway ensues.4, 11 The SD model makes several testable predictions: the companion star should survive the explosion, hydrogen from the donor should be present in the supernova ejecta or swept up by the blast wave, and the system should be a luminous X-ray source during the accretion phase. Observational searches have found limited evidence for these signatures, casting doubt on the SD channel as the dominant pathway.11
In the double-degenerate (DD) model, two carbon-oxygen white dwarfs in a close binary system spiral inward through the emission of gravitational waves until they merge. If the combined mass exceeds the Chandrasekhar limit, or if the merger dynamics produce sufficient heating to ignite carbon detonation even at sub-Chandrasekhar masses, a Type Ia supernova results.11 The DD model naturally explains the absence of hydrogen in Type Ia spectra and the lack of surviving companion stars in supernova remnants, but it faces theoretical challenges in explaining how the merger avoids converting the white dwarf to an oxygen-neon composition (which would lead to collapse rather than explosion) and how it produces the observed uniformity of Type Ia light curves.
A comprehensive review by Maoz, Mannucci, and Nelemans in 2014 concluded that neither model alone can account for all observational constraints, and that both channels likely contribute to the observed Type Ia supernova rate, possibly in different proportions in different stellar environments.11 The progenitor question has direct implications for the use of Type Ia supernovae as standard candles: if the mix of progenitor channels evolves with redshift (because the delay time between star formation and explosion differs between the SD and DD pathways), the average properties of Type Ia supernovae at high redshift could systematically differ from those at low redshift, introducing a bias in cosmological distance measurements.11, 12
Systematic uncertainties
The precision of Type Ia supernova distance measurements has improved dramatically since the late 1990s, but several systematic effects continue to limit their accuracy and are the subject of intensive investigation.
Dust extinction. Interstellar dust in the host galaxy and along the line of sight absorbs and scatters supernova light, making the event appear fainter and redder. Correcting for dust is complicated by the fact that the reddening law (the wavelength dependence of extinction) in supernova host galaxies may differ from the Milky Way average, and by the difficulty of separating intrinsic colour variation in the supernova from extrinsic reddening by dust.6, 7 Modern analyses treat the colour-luminosity relation empirically, fitting a single colour parameter that absorbs both intrinsic and extrinsic effects, but the physical interpretation of this parameter remains debated.7
Host galaxy properties. Studies have revealed that Type Ia supernovae occurring in massive, metal-rich host galaxies are on average approximately 0.08 magnitudes brighter than those in low-mass, metal-poor hosts, even after light-curve shape and colour corrections have been applied.12 This residual correlation, known as the mass step, is thought to reflect an underlying dependence of the supernova's intrinsic luminosity on the metallicity or age of the progenitor stellar population. Because the demographics of host galaxies change with redshift — high-redshift supernova samples contain a larger fraction of low-mass, actively star-forming hosts than low-redshift samples — failure to account for the mass step can introduce a redshift-dependent bias in the Hubble diagram and affect inferences about dark energy.12
Progenitor evolution. If the mix of progenitor systems or the typical properties of the exploding white dwarf (mass, metallicity, carbon-to-oxygen ratio) evolve with cosmic time, the relationship between light-curve parameters and peak luminosity could itself evolve, undermining the assumption that a locally calibrated standardization applies at all redshifts.11 Current data show no statistically significant evidence for such evolution, but the effect remains a concern for future high-precision surveys.
Photometric calibration. At the level of precision now demanded by cosmology (distance uncertainties of a few percent), small systematic errors in the photometric calibration of telescopes and instruments can propagate into significant biases in the measured expansion history. The Pantheon and Pantheon+ analyses have invested substantial effort in cross-calibrating the photometric systems of different surveys, reducing calibration-related systematic uncertainties to a level comparable to the statistical uncertainties.17, 23
Modern supernova samples
The original discovery of accelerating expansion relied on samples of a few dozen Type Ia supernovae. Subsequent surveys have expanded the available data by orders of magnitude, enabling increasingly precise constraints on cosmological parameters.
The Pantheon sample, compiled by Scolnic et al. in 2018, combined 1,048 spectroscopically confirmed Type Ia supernovae from multiple surveys spanning the redshift range 0.01 < z < 2.3, including events from the Sloan Digital Sky Survey, the Supernova Legacy Survey, Pan-STARRS1, and the Hubble Space Telescope. Assuming a flat ΛCDM model, the Pantheon analysis yielded a matter density of ΩM = 0.307 ± 0.012 and, when combined with CMB data, a dark energy equation-of-state parameter consistent with a cosmological constant (w = −1.026 ± 0.041).17
The Pantheon+ analysis, published in 2022, expanded the sample to 1,701 light curves from 1,550 distinct Type Ia supernovae at redshifts from z = 0.001 to z = 2.26, with improved photometric calibration and systematic uncertainty treatment. The Pantheon+ data alone yield ΩM = 0.334 ± 0.018 in a flat ΛCDM model. When combined with CMB and baryon acoustic oscillation (BAO) constraints, the equation-of-state parameter is measured to be w0 = −0.978 with sub-3-percent precision, consistent with a cosmological constant to within the uncertainties.18, 23
Growth of Type Ia supernova samples for cosmology5, 8, 9, 17, 18
Future surveys and next-generation measurements
The next generation of astronomical observatories will increase the number of known Type Ia supernovae by orders of magnitude, fundamentally transforming supernova cosmology from a statistics-limited to a systematics-limited endeavour.
.jpg)
.jpg)
The Vera C. Rubin Observatory, located in Chile, will conduct the Legacy Survey of Space and Time (LSST), a ten-year survey imaging approximately 18,000 square degrees of the southern sky in six optical filters. The LSST is expected to discover hundreds of thousands of Type Ia supernovae over the course of the survey, with well-measured light curves for tens of thousands of events at redshifts up to z ≈ 1. This vast statistical sample will enable unprecedented constraints on the dark energy equation of state and its possible evolution with cosmic time.20 The sheer volume of discoveries will, however, pose new challenges: the vast majority of these events will lack spectroscopic classification, necessitating the development of robust photometric classification algorithms and new approaches to supernova cosmology that do not rely on spectroscopic confirmation of every individual event.20
The Nancy Grace Roman Space Telescope, a NASA mission scheduled for launch no earlier than late 2026, will conduct the High Latitude Time Domain Survey (HLTDS), which is specifically designed for supernova cosmology in the near-infrared. Roman's wide field of view, infrared sensitivity, and onboard spectroscopic capabilities are expected to yield 2,000 to 15,000 Type Ia supernovae suitable for cosmological analysis, with approximately 5,000 at redshifts z > 1 — a regime where existing ground-based surveys have very limited reach.19 Near-infrared observations are particularly valuable for supernova cosmology because Type Ia supernovae are more nearly standard candles at longer wavelengths, with less intrinsic scatter and reduced sensitivity to dust extinction than in the optical bands. The Roman supernova survey is expected to significantly improve measurements of the dark energy equation-of-state parameters w0 and wa, probing whether dark energy is truly a cosmological constant or an evolving field.19
Together, the Rubin Observatory and the Roman Space Telescope will complement each other's strengths: Rubin will provide the enormous statistical samples from the ground in the optical, while Roman will deliver high-precision, infrared-based measurements of individual supernovae at the highest redshifts from space. Combined with ongoing improvements in photometric calibration, light-curve modelling, and understanding of systematic effects, these surveys are poised to determine whether the Hubble tension reflects new physics beyond ΛCDM or a subtle systematic error in the current distance ladder — and to measure the properties of dark energy with percent-level precision for the first time.18, 19, 20
References
SALT2: using distant supernovae to improve the use of Type Ia supernovae as distance indicators
Observational evidence from supernovae for an accelerating universe and a cosmological constant
A comprehensive measurement of the local value of the Hubble constant with 1 km/s/Mpc uncertainty from the Hubble Space Telescope and the SH0ES team
JWST observations reject unrecognized crowding of Cepheid photometry as an explanation for the Hubble tension at 8σ confidence
Status report on the Chicago-Carnegie Hubble Program (CCHP): measurement of the Hubble constant using the Hubble and James Webb Space Telescopes
The complete light-curve sample of spectroscopically confirmed SNe Ia from Pan-STARRS1 and cosmological constraints from the combined Pantheon sample
A reference survey for supernova cosmology with the Nancy Grace Roman Space Telescope