Overview
- Baryon acoustic oscillations (BAO) are a frozen imprint of sound waves that propagated through the hot plasma of the early universe before recombination, leaving a characteristic excess of galaxy pairs separated by approximately 150 megaparsecs that serves as a cosmic standard ruler for measuring the expansion history of the universe.
- First detected in 2005 by the Sloan Digital Sky Survey and the Two-degree Field Galaxy Redshift Survey, BAO measurements have become one of the primary observational probes of dark energy and cosmic acceleration, complementing Type Ia supernovae and cosmic microwave background data.
- Modern surveys including the Baryon Oscillation Spectroscopic Survey and the Dark Energy Spectroscopic Instrument have measured the BAO scale to better than one percent precision across multiple redshift bins, yielding tight constraints on the Hubble constant, matter density, and the dark energy equation of state.
Baryon acoustic oscillations (BAO) are a pattern imprinted on the large-scale distribution of galaxies by sound waves that travelled through the hot, ionised plasma of the early universe during the first few hundred thousand years after the Big Bang. Before the epoch of recombination, when the universe cooled enough for electrons and protons to combine into neutral hydrogen, pressure waves driven by the interplay of gravity and radiation pressure propagated outward from regions of slight overdensity at roughly half the speed of light. When recombination occurred approximately 380,000 years after the Big Bang, photons decoupled from baryonic matter and these acoustic waves froze in place, leaving a characteristic spherical shell of excess matter with a radius of approximately 150 megaparsecs (Mpc) in today's comoving coordinates around each initial overdensity.1, 2 This preferred separation scale is imprinted in the clustering statistics of galaxies and constitutes a standard ruler whose physical size is predicted from well-understood early-universe physics, making BAO one of the most powerful tools in modern observational cosmology for measuring the expansion history of the universe and constraining the properties of dark energy.
The theoretical prediction of baryon acoustic oscillations dates to 1970, but their observational detection in galaxy surveys was not achieved until 2005, when analyses of the Sloan Digital Sky Survey (SDSS) and the Two-degree Field Galaxy Redshift Survey (2dFGRS) independently identified the BAO signal in the galaxy correlation function and power spectrum.7, 8 In the two decades since that landmark detection, successively larger and more precise galaxy surveys have refined BAO measurements to sub-percent accuracy, transforming them into one of the three pillars of observational cosmology alongside Type Ia supernovae and the cosmic microwave background (CMB).
Physics of the sound horizon
The physical origin of baryon acoustic oscillations lies in the behaviour of the baryon-photon plasma that filled the universe before recombination. In the earliest moments after the Big Bang, the universe was an extremely hot, dense, ionised gas in which baryonic matter (primarily protons, neutrons, and electrons) was tightly coupled to photons through Thomson scattering. Tiny perturbations in the density of this plasma, seeded during cosmic inflation, set up competing forces: gravity pulled matter inward toward overdense regions, while the enormous radiation pressure of the photons pushed outward. The result was a series of acoustic oscillations, analogous to sound waves, that propagated outward through the plasma at a speed determined by the sound speed of the coupled baryon-photon fluid.1, 2
The sound speed in the baryon-photon plasma is given approximately by cs = c / √(3(1 + R)), where c is the speed of light and R is the ratio of the baryon energy density to the photon energy density. Early in the universe's history, when radiation dominated, R was small and the sound speed approached c / √3, or approximately 57 percent of the speed of light. As the universe expanded and cooled, the baryon contribution grew and the sound speed decreased slightly.1, 4
The sound horizon at the epoch of recombination, denoted rs, is the comoving distance that a sound wave could travel from the Big Bang until the moment when photons decoupled from baryons, at a redshift of approximately z = 1089. This distance, which depends on the baryon density, the radiation density, and the expansion rate of the early universe, is predicted by standard cosmological models to be approximately 147 megaparsecs (about 480 million light-years in comoving coordinates).19 The Planck satellite's precise measurements of the CMB power spectrum have determined this value to better than 0.2 percent precision: rs = 147.09 ± 0.26 Mpc.19 Because this distance is computed from well-understood physics of the early universe, it provides an absolute calibration for the BAO standard ruler that is largely independent of astrophysical uncertainties at low redshift.
When recombination occurred, photons streamed freely away from the baryons, removing the radiation pressure that had been driving the acoustic oscillations. The baryonic matter shells, which had been carried outward by the sound waves, stalled at the sound horizon radius and remained there as slight overdensities. Over the subsequent billions of years, gravitational instability amplified these and all other density perturbations, with galaxies preferentially forming both at the original overdense centres and along the shells at the sound horizon radius. The result is a small but statistically detectable excess probability of finding pairs of galaxies separated by approximately 150 Mpc.5, 7
Theoretical predictions
The theoretical framework for understanding acoustic oscillations in the early universe was developed independently by P. J. E. Peebles and J. T. Yu in the United States and by R. A. Sunyaev and Ya. B. Zeldovich in the Soviet Union, both in 1970.1, 2 Both groups solved the coupled equations governing the evolution of perturbations in the baryon-photon fluid and demonstrated that acoustic oscillations would leave characteristic features in both the CMB temperature fluctuations and the matter distribution at late times. Even earlier, in 1966, the Soviet physicist Andrei Sakharov had noted that oscillatory features could arise in the spectrum of density perturbations in an expanding universe, and the resulting features in the matter power spectrum are sometimes called Sakharov oscillations in recognition of this contribution.
In 1968, Joseph Silk showed that photon diffusion during the epoch before recombination would damp small-scale perturbations exponentially, a process now called Silk damping.3 This damping erases acoustic oscillations below a characteristic scale (the Silk scale), which corresponds to roughly 10 Mpc in comoving coordinates. Perturbations on scales larger than the Silk scale preserve the oscillatory pattern, while those on smaller scales are smoothed out. The interplay between the acoustic oscillation scale and the Silk damping scale shapes the detailed form of both the CMB angular power spectrum and the matter power spectrum.
In the late 1990s, several groups developed the quantitative predictions needed to detect BAO in galaxy surveys. Eisenstein and Hu provided fitting formulae for the matter transfer function that explicitly included baryonic oscillation features, showing that for cosmologies with realistic baryon fractions the oscillations modulate the matter power spectrum by approximately 5 to 10 percent.4 Meiksin, White, and Peacock computed the expected oscillatory features in detail and emphasised that upcoming galaxy surveys could in principle detect them.5 Eisenstein, Hu, and Tegmark demonstrated that combining CMB measurements of the acoustic scale with detections of the same scale in galaxy redshift surveys would yield substantially tighter constraints on the Hubble constant and the matter density than either probe alone, a principle they termed cosmic complementarity.6
First detections in galaxy surveys
The detection of baryon acoustic oscillations in the distribution of galaxies required mapping the three-dimensional positions of hundreds of thousands of galaxies over a volume large enough to encompass many times the 150 Mpc BAO scale. Two surveys achieved this milestone almost simultaneously in 2005.
Daniel Eisenstein and collaborators analysed a sample of 46,748 luminous red galaxies (LRGs) from the Sloan Digital Sky Survey, covering a volume of 0.72 h−3 Gpc3 over 3,816 square degrees in the redshift range 0.16 < z < 0.47. They computed the two-point correlation function of the galaxy distribution and identified a clear peak at a comoving separation of approximately 100 h−1 Mpc (roughly 150 Mpc for the favoured value of the Hubble parameter), in excellent agreement with the predicted location and shape of the BAO feature. This detection yielded a 4 percent measurement of the distance to redshift z = 0.35.7
Independently, Shaun Cole and collaborators analysed the power spectrum of 221,414 galaxies from the final data set of the Two-degree Field Galaxy Redshift Survey (2dFGRS) and identified oscillatory features in the power spectrum that matched the predicted baryon acoustic signature. The 2dFGRS analysis provided complementary confirmation of the BAO signal using a different survey geometry, different galaxy population, and a Fourier-space (power spectrum) statistic rather than the configuration-space (correlation function) approach used by the SDSS team.8
These two detections established BAO as a practical cosmological tool and opened a new era in precision cosmology. The BAO scale provides a geometric measurement of the distance-redshift relation that is largely insensitive to the complex astrophysical processes governing galaxy formation, because the relevant physics is the large-scale gravitational clustering of matter rather than the small-scale details of how individual galaxies form and evolve.7, 17
BAO as a standard ruler
A standard ruler is an object or feature whose physical size is known, so that its apparent angular size or its apparent separation in redshift space can be used to infer a distance. The BAO scale is the premier standard ruler in cosmology because its physical size, the sound horizon at the drag epoch, is determined by early-universe physics to sub-percent precision.17, 19
In practice, BAO measurements constrain two distinct distance measures depending on the orientation of the galaxy-pair separation relative to the line of sight. Separations measured perpendicular to the line of sight (transverse separations) constrain the angular diameter distance DM(z) to the effective redshift of the survey. Separations measured along the line of sight (radial separations, inferred from redshift differences) constrain the Hubble parameter H(z) at that redshift. When the two directions cannot be distinguished, the BAO measurement constrains a combination of these quantities, often expressed as the volume-averaged distance DV(z) = [z DM(z)2 c / H(z)]1/3.7, 17
The power of BAO as a cosmological probe stems from several properties. First, the BAO scale is large, approximately 150 Mpc, which places it firmly in the linear or weakly nonlinear regime of gravitational structure formation, where the physics is well understood and can be modelled with high accuracy. Second, the feature is a characteristic scale, not an amplitude, making it robust against many systematic effects that alter the overall amplitude of galaxy clustering, such as galaxy bias (the relationship between where galaxies form and where matter is located). Third, the BAO standard ruler can be measured at multiple redshifts by surveying galaxies at different distances, mapping out the expansion history of the universe as a function of cosmic time.17
BAO distance measurements from major galaxy surveys7, 10, 11, 12, 13
The chart above illustrates the progressive improvement in the precision of BAO distance measurements from the first detections in 2005 to the most recent results from DESI in 2025. The percentage indicates the fractional uncertainty in the distance measurement at each survey's effective redshift. What began as a 4 percent measurement with 47,000 galaxies has become a sub-percent measurement with millions of galaxies, tracking the enormous growth in survey volume over two decades.7, 9, 20
Reconstruction of the BAO signal
Although the BAO feature is robust against many systematic effects, its sharpness is degraded over cosmic time by the nonlinear gravitational evolution of the matter distribution. As galaxies move under the influence of gravitational attraction from surrounding structures, their positions are displaced from the locations predicted by linear perturbation theory, smearing the BAO peak in the correlation function and reducing its contrast. This effect, which increases with decreasing redshift, limits the precision with which the BAO scale can be measured from the raw galaxy distribution.14
In 2007, Eisenstein, Seo, Sirko, and Spergel proposed a technique called density-field reconstruction to reverse much of this nonlinear degradation. The method estimates the displacement field that moved galaxies from their initial (linear-theory) positions to their observed positions, using the observed galaxy density field itself along with the Zel'dovich approximation (a first-order perturbation theory prediction for gravitational displacement). By shifting galaxies back along the estimated displacement vectors, reconstruction partially undoes the nonlinear smearing and sharpens the BAO peak.14
The practical application of reconstruction was demonstrated by Padmanabhan and collaborators using the SDSS DR7 luminous red galaxy sample. Before reconstruction, the BAO distance measurement had a fractional uncertainty of 3.5 percent. After reconstruction, this uncertainty shrank to 1.9 percent, equivalent to the precision that would have been obtained from a survey three times larger without reconstruction.15 Reconstruction has since become a standard step in all BAO analyses and has been adopted by the BOSS, WiggleZ, and DESI collaborations. The technique's effectiveness derives from the fact that the large-scale displacement field responsible for smearing the BAO peak can be estimated with reasonable accuracy from the data themselves, even when the displacements on smaller scales are poorly known.12, 13
Major survey programs
The progression of BAO measurements has been driven by a series of increasingly ambitious galaxy redshift surveys, each mapping larger volumes of the universe with greater numbers of galaxies.
The 6dF Galaxy Survey (6dFGS), conducted with the Six-degree Field instrument on the UK Schmidt Telescope in Australia, measured redshifts for approximately 125,000 galaxies in the southern sky at a median redshift of z = 0.11. Beutler and collaborators detected the BAO signal in the 6dFGS correlation function in 2011, providing the lowest-redshift BAO measurement and a constraint on the distance ratio rs / DV at 4.5 percent precision.10
The WiggleZ Dark Energy Survey, carried out with the AAOmega spectrograph at the Anglo-Australian Telescope, obtained redshifts for approximately 200,000 emission-line galaxies across 1,000 square degrees. Blake and collaborators measured the BAO scale at three redshifts (z = 0.44, 0.6, and 0.73), producing the first BAO measurements at redshifts above 0.5 from galaxy clustering alone. The combined statistical significance of the BAO detection across all three WiggleZ redshift bins, stacked with the 6dFGS and SDSS measurements, reached 4.9 sigma relative to a zero-baryon model with no acoustic peak.11
The Baryon Oscillation Spectroscopic Survey (BOSS), part of the third phase of the Sloan Digital Sky Survey (SDSS-III), represented a transformative step in survey scale. BOSS used a purpose-built spectrograph to obtain redshifts for 1.5 million galaxies and 160,000 quasars over 10,000 square degrees, covering the redshift range 0.2 < z < 0.7 for galaxies and extending to z > 2 using the Lyman-alpha forest absorption in quasar spectra. The final BOSS data release (DR12) achieved BAO distance measurements with sub-percent precision: 1.0 percent at the effective redshift z = 0.38, 0.9 percent at z = 0.51, and 1.1 percent at z = 0.61.12, 13 These measurements provided the most stringent constraints on the expansion history of the universe over the redshift range 0.2 to 0.7 and, combined with CMB and supernova data, yielded tight constraints on dark energy and spatial curvature.16
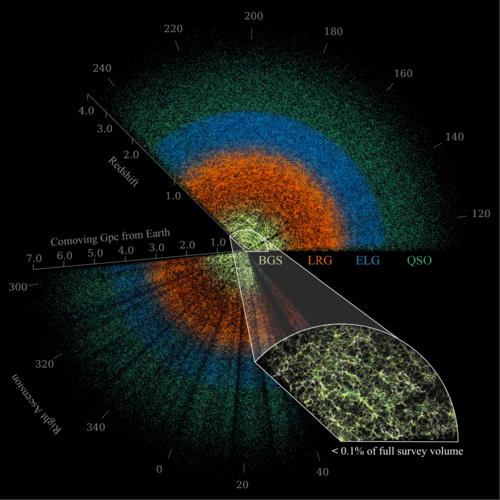
The Dark Energy Spectroscopic Instrument (DESI), which began operations in 2021 on the Mayall 4-metre Telescope at Kitt Peak National Observatory in Arizona, represents the current state of the art. DESI can simultaneously obtain spectra of 5,000 objects using robotic fibre positioners, enabling it to measure redshifts for tens of millions of galaxies and quasars. The first-year data release (DR1) in 2024 included BAO measurements from over 6 million extragalactic objects spanning the redshift range 0.1 < z < 4.2, the widest redshift coverage of any single BAO analysis.18 The second data release (DR2) in 2025, based on three years of observations and more than 14 million objects, further improved the precision to approximately 0.4 percent at the best-measured redshifts, making it the most precise BAO measurement to date.20
Cosmological constraints from BAO
BAO measurements constrain the expansion history of the universe and, when combined with other data, yield precise determinations of fundamental cosmological parameters. Because the BAO method provides a geometric distance measurement at each surveyed redshift, it traces the distance-redshift relation D(z), which depends on the composition of the universe through the Friedmann equation. Different cosmological models predict different functional forms for D(z), so mapping this relation observationally discriminates between models.17
Within the standard flat Lambda-CDM (ΛCDM) cosmological model, BAO data alone constrain the matter density parameter to Ωm = 0.295 ± 0.015.18 When combined with a baryon density prior from Big Bang nucleosynthesis and the precisely measured acoustic angular scale from the CMB, DESI BAO data require a Hubble constant of H0 = 68.52 ± 0.62 km s−1 Mpc−1.18 This value is consistent with the Planck CMB determination of H0 = 67.4 ± 0.5 km s−1 Mpc−1 and is in tension with the local distance ladder measurement of H0 = 73.0 ± 1.0 km s−1 Mpc−1, a discrepancy known as the Hubble tension.19
For dark energy, BAO data combined with CMB and supernova observations constrain the dark energy equation-of-state parameter w, defined as the ratio of dark energy pressure to its energy density. In a cosmological constant model, w = −1 exactly. The BOSS DR12 analysis, combined with Planck CMB data, measured w = −1.01 ± 0.06, fully consistent with a cosmological constant.13, 16 The DESI DR1 results, however, found intriguing hints of departures from a cosmological constant when the dark energy equation of state was allowed to vary with time. Parameterising the time evolution as w(a) = w0 + wa(1 − a), where a is the cosmic scale factor, the DESI data combined with CMB observations preferred w0 > −1 and wa < 0 at the 2.6-sigma level.18 If confirmed, this would imply that dark energy is not a cosmological constant but a dynamical field whose equation of state evolves over cosmic history.
The DESI DR2 results, with roughly twice the data of DR1, found that the preference for dynamical dark energy did not diminish relative to DR1, with the evidence described as a mild 2.3-sigma tension with the parameters determined from the CMB alone.20 These results have generated substantial interest in the cosmological community because a detection of dynamical dark energy would constitute evidence for new physics beyond the standard ΛCDM model.
BAO measurements also contribute to constraints on neutrino masses. Because massive neutrinos suppress the growth of structure on scales smaller than their free-streaming length, the BAO signal provides indirect sensitivity to the sum of neutrino masses. The combination of DESI BAO with CMB data yields an upper limit of Σmν < 0.072 eV at 95 percent confidence, among the tightest constraints from cosmological data.18
Comparison with other cosmological probes
The BAO method is one of several independent techniques used to map the expansion history of the universe and constrain dark energy. Each technique has distinct strengths, systematics, and redshift ranges, and the most powerful constraints come from combining multiple probes.
Type Ia supernovae serve as standardisable candles whose luminosity distance can be measured as a function of redshift. Supernova measurements were the first to reveal the accelerating expansion of the universe in 1998 and remain the most direct probe of the luminosity distance-redshift relation. However, supernova cosmology is subject to systematic uncertainties in the calibration of supernova luminosities, dust extinction corrections, and potential evolution of the supernova population with redshift.17 BAO measurements, by contrast, are purely geometric and have different, largely independent systematics.
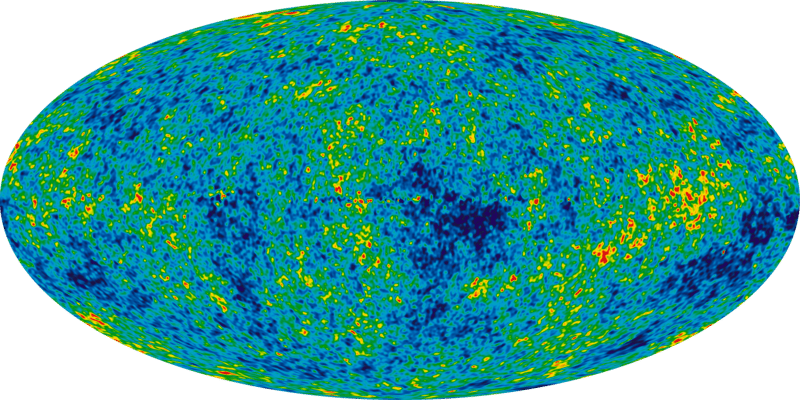
The CMB provides exquisitely precise measurements of cosmological parameters at a single epoch (z = 1089), including the acoustic scale, the matter density, the baryon density, and the geometry of the universe. The CMB and BAO are complementary because they probe the same acoustic scale at vastly different epochs. The CMB measures the angular size of the sound horizon at recombination, while BAO measure the apparent size of the same ruler in the galaxy distribution at much lower redshifts. Comparing the two measurements constrains the expansion history between z = 1089 and the BAO survey redshift, providing sensitivity to dark energy and spatial curvature.17, 19
Comparison of major cosmological distance probes17
| Probe | Type | Redshift range | Key systematic | Measures |
|---|---|---|---|---|
| BAO | Standard ruler | 0.1–4 | Nonlinear evolution, galaxy bias | DM(z), H(z) |
| Type Ia supernovae | Standard candle | 0.01–2 | Calibration, dust, evolution | DL(z) |
| CMB | Angular scale | ~1089 | Foreground subtraction | θs, cosmological parameters |
| Weak lensing | Shear field | 0.1–3 | Shape measurement, photometric z | Growth of structure |
| Galaxy clusters | Abundance | 0–2 | Mass calibration | σ8, Ωm |
The power of BAO lies not only in its individual precision but in its near-orthogonal relationship to the systematics of other probes. Supernovae constrain relative distances (distance ratios between redshifts) very well but require external calibration of the absolute luminosity scale. BAO provide absolute distance measurements anchored to early-universe physics, breaking degeneracies that supernova data alone cannot resolve. When combined, the two probes yield substantially tighter constraints on dark energy parameters than either provides individually.16, 17
Lyman-alpha forest BAO
At redshifts above approximately 2, where few galaxies bright enough for spectroscopic surveys exist in sufficient numbers, the BAO signal can instead be measured using the Lyman-alpha forest, the dense pattern of absorption lines produced by neutral hydrogen in the intergalactic medium along the line of sight to distant quasars. Each Lyman-alpha absorption feature corresponds to a cloud of hydrogen at a specific redshift, and the ensemble of absorption features across many quasar sightlines traces the three-dimensional distribution of matter at high redshift.
The BOSS survey pioneered the use of the Lyman-alpha forest for BAO measurements, detecting the BAO signal in the auto-correlation of the forest and in the cross-correlation between Lyman-alpha absorption and quasar positions at an effective redshift of z = 2.34. This provided the first measurement of the expansion rate of the universe at an epoch before the onset of cosmic acceleration, when the expansion was still decelerating under the gravitational pull of matter.13, 16 The detection confirmed a key prediction of the ΛCDM model: that the transition from deceleration to acceleration occurred at a redshift of approximately z = 0.7.
DESI has extended Lyman-alpha forest BAO measurements with substantially larger quasar samples. The DR1 analysis included Lyman-alpha data at an effective redshift of z = 2.33, derived from over 420,000 quasar spectra, making it the most precise high-redshift BAO measurement.18 This high-redshift anchor, when combined with the galaxy BAO measurements at lower redshifts, provides a long baseline for tracing the expansion history from the matter-dominated era through the dark-energy-dominated era, maximising sensitivity to possible evolution of the dark energy equation of state.
Systematics and challenges
Although BAO measurements are widely regarded as among the most robust probes in cosmology, they are not free of systematic effects, and the ongoing push toward sub-percent precision has required increasingly careful treatment of potential biases.
Nonlinear structure formation is the dominant systematic concern. Gravitational evolution on scales approaching and below the BAO feature causes both a broadening of the acoustic peak (reducing its contrast and precision) and a slight shift in its position. Analytic models and numerical simulations predict that the shift is small, approximately 0.3 to 0.5 percent of the sound horizon, but this is comparable to the statistical precision of current surveys and must be corrected. Reconstruction partially mitigates both the broadening and the shift, but residual effects must be modelled and included in the error budget.14, 15
Galaxy bias, the relationship between the galaxy distribution and the underlying matter distribution, in principle affects the BAO measurement because galaxies are biased tracers of the density field. However, because galaxy bias primarily affects the overall amplitude and broad shape of the correlation function rather than the position of the acoustic peak, its impact on the BAO scale measurement is small. Detailed tests with mock galaxy catalogues derived from N-body simulations have confirmed that galaxy bias introduces negligible shifts in the recovered BAO position.12, 13
Observational systematics in galaxy surveys include variations in the completeness of spectroscopic observations across the survey footprint, fibre collisions (the inability to simultaneously observe two galaxies closer than the minimum fibre-to-fibre spacing), and photometric calibration errors that affect target selection. Each of these effects can introduce spurious large-scale correlations that, if unaccounted for, could contaminate the BAO signal. Modern surveys address these systematics through detailed forward-modelling of the survey geometry, angular completeness maps, and extensive testing with mock catalogues.12, 18
Redshift-space distortions arise because the observed redshifts of galaxies include contributions from both the Hubble flow (the cosmological expansion) and peculiar velocities (motion induced by local gravitational fields). Peculiar velocities distort the apparent positions of galaxies along the line of sight, compressing structures on large scales (the Kaiser effect) and elongating them on small scales (the Fingers of God effect). These distortions affect the anisotropy of the correlation function and must be modelled when extracting the BAO scale from the data. However, because the BAO is a feature in the isotropic (angle-averaged) correlation function, the primary effect of redshift-space distortions on the BAO measurement is an alteration of the anisotropic signal rather than a bias in the isotropic BAO position.13, 17
Future prospects
The next decade of BAO science will be shaped by the completion of the DESI survey and the launch and operation of several new facilities designed to extend BAO measurements to higher redshifts, larger volumes, and greater precision.
DESI is planned to operate for five years, ultimately obtaining spectra for approximately 40 million galaxies and quasars. The full survey will provide BAO measurements across the redshift range 0.05 < z < 4.5 with statistical precision approaching 0.1 percent at the best-measured redshifts. This level of precision will enable definitive tests of whether the dark energy equation of state varies with time, potentially confirming or excluding the intriguing hints of dynamical dark energy seen in the DR1 and DR2 results.18, 20
The Euclid space telescope, launched by the European Space Agency in 2023, is conducting a wide-field survey of approximately 15,000 square degrees in the near-infrared, obtaining spectroscopic redshifts for tens of millions of galaxies in the redshift range 0.9 < z < 1.8. Euclid's space-based vantage point avoids atmospheric effects and enables uniform photometry across the survey, reducing systematic uncertainties in target selection. The combination of Euclid's high-redshift galaxy BAO measurements with DESI's wide-redshift-range data will provide unprecedented coverage of the distance-redshift relation.
The Nancy Grace Roman Space Telescope, scheduled for launch by NASA in the mid-2020s, will include a high-latitude survey capable of measuring BAO from emission-line galaxies at redshifts 1 < z < 3. The Roman survey's grism spectroscopy will provide a large, independent sample of galaxies at redshifts that overlap with both Euclid and DESI, enabling cross-validation of BAO measurements between surveys and tight control of systematic effects.
Looking further ahead, proposed ground-based facilities such as the MegaMapper concept would use a massively multiplexed fibre spectrograph on a dedicated 6.5-metre telescope to obtain spectra for over 100 million galaxies at redshifts 2 < z < 5, extending BAO measurements deep into the matter-dominated era. Such a survey would measure the expansion rate at epochs where dark energy's contribution is negligible, providing a critical baseline for isolating the onset and evolution of cosmic acceleration. The combination of ground-based and space-based BAO data, covering the full redshift range from the local universe to redshift 5, would map the expansion history of the universe with exquisite precision across more than 12 billion years of cosmic time.17
References
Cosmic complementarity: H₀ and Ωm from combining cosmic microwave background experiments and redshift surveys
Detection of the baryon acoustic peak in the large-scale correlation function of SDSS luminous red galaxies
The 2dF Galaxy Redshift Survey: power-spectrum analysis of the final data set and cosmological implications
Baryon acoustic oscillations in the Sloan Digital Sky Survey Data Release 7 galaxy sample
The WiggleZ Dark Energy Survey: mapping the distance–redshift relation with baryon acoustic oscillations
The clustering of galaxies in the SDSS-III Baryon Oscillation Spectroscopic Survey: baryon acoustic oscillations in the Data Releases 10 and 11 galaxy samples
The clustering of galaxies in the completed SDSS-III Baryon Oscillation Spectroscopic Survey: cosmological analysis of the DR12 galaxy sample
Improving cosmological distance measurements by reconstruction of the baryon acoustic peak
A 2 per cent distance to z = 0.35 by reconstructing baryon acoustic oscillations – I. Methods and application to the Sloan Digital Sky Survey
DESI 2024 VI: Cosmological constraints from the measurements of baryon acoustic oscillations
DESI DR2 results II: Measurements of baryon acoustic oscillations and cosmological constraints