Overview
- Volcanic eruptions produce an array of lethal hazards including pyroclastic density currents, lahars, tephra fall, and toxic gas emissions, with pyroclastic flows alone responsible for roughly one-third of all volcanic fatalities since 1600 CE.
- Modern volcano monitoring integrates seismology, satellite-based ground deformation measurements via InSAR and GPS, gas emission spectroscopy, and thermal remote sensing to detect the precursory signals of volcanic unrest and provide early warnings of impending eruptions.
- Eruptions are classified by the logarithmic Volcanic Explosivity Index from 0 to 8, and while supervolcanic events of VEI 7–8 such as Toba (~74,000 years ago) can trigger hemispheric cooling and global disruption, their recurrence intervals of tens to hundreds of thousands of years make them far less frequent than the moderate eruptions that pose the most immediate threat to the roughly 800 million people living within 100 kilometres of an active volcano.
Volcanic eruptions rank among the most destructive natural phenomena on Earth, capable of killing thousands of people in minutes, disrupting global air travel for weeks, and altering the planet's climate for years. Approximately 800 million people live within 100 kilometres of a historically active volcano, and roughly 500 volcanoes have erupted during recorded history, with an average of 50 to 70 producing eruptions in any given year.17, 19 The hazards associated with volcanic eruptions are diverse, ranging from fast-moving pyroclastic density currents and lahars to the slow, insidious accumulation of toxic gases and the injection of sulfur aerosols into the stratosphere. Understanding these hazards and developing the capacity to forecast eruptions are among the central missions of modern volcanology, drawing on seismology, geodesy, geochemistry, satellite remote sensing, and computational modelling to reduce the risk posed by the roughly 1,500 potentially active volcanoes worldwide.9, 17
The Volcanic Explosivity Index
The magnitude of explosive volcanic eruptions is measured using the Volcanic Explosivity Index (VEI), a logarithmic scale from 0 to 8 devised by Chris Newhall and Stephen Self in 1982.1 The VEI integrates several observable parameters — the volume of tephra (fragmental material) ejected, the height of the eruption column, the duration of continuous blast, and qualitative descriptions of eruptive style — into a single integer rating. Each step on the scale above VEI 2 represents a roughly tenfold increase in the volume of ejecta: a VEI 3 eruption produces at least 107 cubic metres of tephra, whereas a VEI 8 event ejects more than 1012 cubic metres, equivalent to over 1,000 cubic kilometres of material.1
Eruptions at VEI 0 and 1 are non-explosive to mildly explosive, characterised by lava effusion and gentle steam emission. VEI 2 events are described as "explosive," producing small eruption columns and localised ashfall. The moderate eruptions rated VEI 3 to 4 can devastate areas within tens of kilometres of the vent and deposit centimetre-thick tephra blankets over hundreds of square kilometres. Major eruptions at VEI 5, such as Mount St. Helens in 1980, inject material into the stratosphere and affect areas thousands of square kilometres in extent.1, 4 At the upper end of the scale, VEI 6 eruptions (Pinatubo, 1991) and VEI 7 events (Tambora, 1815) have measurable effects on global climate, while VEI 8 eruptions — the supervolcanic events discussed below — can deposit ash across entire continents and trigger prolonged volcanic winters.7, 14
Volcanic Explosivity Index: scale, examples, and approximate recurrence1, 16, 17
| VEI | Description | Ejecta volume | Column height | Historical example | Approx. frequency |
|---|---|---|---|---|---|
| 0 | Non-explosive | <104 m³ | <100 m | Kīlauea (ongoing) | Daily |
| 1 | Gentle | >104 m³ | 100–1,000 m | Stromboli (frequent) | Daily |
| 2 | Explosive | >106 m³ | 1–5 km | Galeras, 1993 | Weekly |
| 3 | Severe | >107 m³ | 3–15 km | Nevado del Ruiz, 1985 | Yearly |
| 4 | Cataclysmic | >108 m³ | 10–25 km | Eyjafjallajökull, 2010 | ~Every 18 months |
| 5 | Paroxysmal | >109 m³ | >25 km | Mt. St. Helens, 1980 | ~Every 12 years |
| 6 | Colossal | >1010 m³ | >25 km | Pinatubo, 1991 | ~Every 50–100 years |
| 7 | Super-colossal | >1011 m³ | >25 km | Tambora, 1815 | ~Every 500–1,000 years |
| 8 | Mega-colossal | >1012 m³ | >25 km | Toba, ~74 ka | ~Every 50,000–100,000 years |
Primary hazards
The hazards produced directly by volcanic eruptions are classified as primary hazards and include pyroclastic density currents, tephra fall, lava flows, volcanic gases, and lahars. A comprehensive database of volcanic fatalities from 1600 to 2010 CE records at least 278,000 deaths attributable to volcanic activity, with pyroclastic density currents, tsunami (often volcanically triggered), and lahars accounting for the majority of fatalities.2
Pyroclastic density currents are fast-moving, ground-hugging flows of hot gas, ash, and rock fragments generated by the gravitational collapse of eruption columns, the explosive disintegration of lava domes, or lateral blasts. They travel at velocities of 100 to 700 kilometres per hour at temperatures of 200 to over 700 degrees Celsius, making them virtually impossible to outrun and invariably lethal to anyone caught in their path.3, 18 The AD 79 eruption of Vesuvius produced multiple pyroclastic surges that overwhelmed the Roman cities of Pompeii and Herculaneum, killing their remaining inhabitants within seconds as temperatures in the surge clouds exceeded 300 degrees Celsius.3 Analysis of the global volcanic fatalities record shows that pyroclastic density currents have caused approximately one-third of all recorded volcanic deaths since 1600 CE.2
Tephra fall refers to the airborne fragments of volcanic rock, from fine ash (less than 2 millimetres in diameter) to large ballistic blocks, that are ejected into the atmosphere and settle under gravity. While fine ashfall rarely kills directly, heavy accumulations can collapse roofs, contaminate water supplies, damage crops, disrupt transportation and electrical infrastructure, and cause respiratory distress in exposed populations.1, 13 During Plinian eruptions, pumice and ash can accumulate metres deep within tens of kilometres of the vent. At Pompeii in 79 CE, roughly 2.5 metres of pumice fall accumulated on the city over the first seven hours of the eruption, causing widespread structural collapse before the pyroclastic surges arrived.3
Lava flows are streams of molten rock that issue from volcanic vents and move downslope under gravity. Their velocities are generally low enough to permit evacuation, typically 1 to 10 kilometres per hour for basaltic flows and much slower for more viscous compositions. Although lava flows destroy everything in their path through incineration and burial, they are responsible for relatively few fatalities compared with other volcanic hazards, accounting for less than 1 percent of all volcanic deaths in the historical record.2, 18
Volcanic gases, principally water vapour, carbon dioxide (CO2), sulfur dioxide (SO2), hydrogen sulfide (H2S), and hydrogen fluoride (HF), are released continuously from active volcanoes and in massive pulses during eruptions. CO2 is denser than air and can accumulate in topographic depressions, creating lethal invisible pools; the 1986 limnic eruption of Lake Nyos in Cameroon released a cloud of CO2 that killed approximately 1,700 people and thousands of livestock in nearby valleys.22 SO2 emissions can produce acidic aerosols that damage vegetation, corrode infrastructure, and cause respiratory illness. Prolonged volcanic degassing, known as "vog" (volcanic fog) in Hawai'i, creates chronic air-quality problems for communities near persistently active volcanoes.22, 12
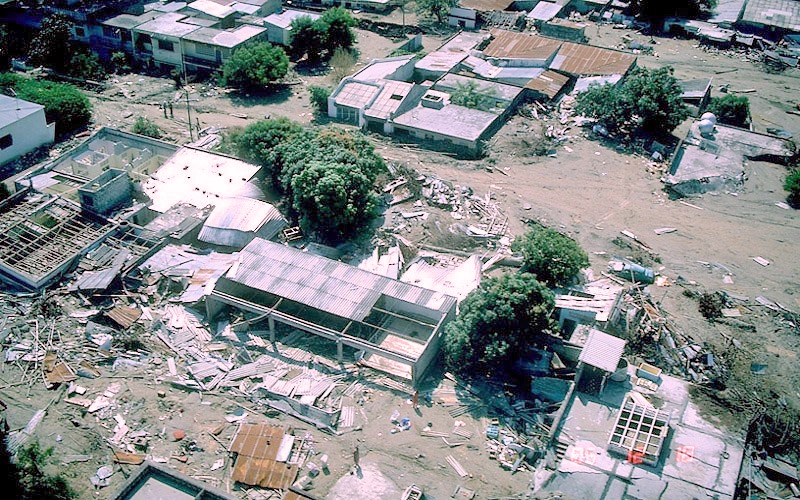
Lahars are rapidly flowing mixtures of volcanic debris and water that travel down river valleys at velocities of 20 to 60 kilometres per hour, with the consistency of wet concrete and the destructive power to obliterate bridges, buildings, and entire towns. They can be triggered by the melting of summit glaciers and snowpack during eruptions, the failure of crater lakes, or intense rainfall on loose volcanic deposits. The most catastrophic lahar disaster in modern history occurred on 13 November 1985, when a modest eruption of Nevado del Ruiz in Colombia melted part of the summit ice cap, generating lahars that descended river valleys and buried the town of Armero under several metres of mud and debris, killing approximately 23,000 people.8 The Armero catastrophe demonstrated that even small eruptions can produce devastating secondary effects and underscored the lethal consequences of inadequate hazard communication and evacuation planning.
Secondary and far-field hazards
Beyond the immediate vicinity of the volcano, eruptions can generate hazards that affect regions and even the entire globe. Volcanic tsunamis, aviation ash hazards, and climate perturbation from stratospheric aerosols represent the principal secondary threats.
Volcanic tsunamis are generated by several mechanisms, including the entry of pyroclastic density currents into the sea, the collapse of volcanic edifice flanks, submarine explosions, and caldera formation. The 1883 eruption of Krakatau (Krakatoa) in the Sunda Strait between Java and Sumatra produced a series of devastating tsunamis when massive pyroclastic flows entered the sea and the volcanic edifice collapsed to form a submarine caldera. Waves reached heights of 30 metres or more along the coastlines of western Java and southern Sumatra, killing approximately 36,000 people and ranking the event among the deadliest volcanic disasters in recorded history.20, 21 Numerical modelling has confirmed that the rapid entrance of pyroclastic flows into shallow water was the principal tsunami-generating mechanism during the 1883 event.21
Aviation ash hazards pose a severe threat to modern air travel. Volcanic ash particles are abrasive, can erode turbine blades and windshields, and when ingested into jet engines at high temperatures can melt and re-solidify as glassy deposits on turbine components, potentially causing engine failure. The April–May 2010 eruption of Eyjafjallajökull in Iceland, although of only moderate size (VEI 4), ejected fine-grained silicic ash into the jet stream that was carried across northern and central Europe, resulting in the closure of airspace over much of the continent for six days and the cancellation of over 100,000 flights affecting roughly 10 million passengers.13 The economic cost of the disruption was estimated at 1.5 to 5 billion US dollars. The Eyjafjallajökull crisis exposed the vulnerability of modern aviation to even moderate volcanic eruptions and prompted a revision of international protocols for managing volcanic ash in airspace.13
Climate impacts from sulfur aerosols represent the most globally significant consequence of large explosive eruptions. When SO2 is injected into the stratosphere above approximately 15 to 25 kilometres altitude, it reacts with water vapour to form sulfuric acid (H2SO4) aerosol droplets with an atmospheric residence time of one to three years. These aerosol particles scatter incoming solar radiation back into space, reducing the amount of sunlight reaching the surface and producing a net cooling effect on global mean surface temperature.6 The 1991 eruption of Mount Pinatubo in the Philippines (VEI 6) injected approximately 17 megatons of SO2 into the stratosphere, producing a global aerosol cloud that reduced incoming solar radiation by roughly 10 percent and lowered global mean surface temperature by approximately 0.5 degrees Celsius over the following two years.5, 6 The 1815 eruption of Tambora (VEI 7) caused the "Year Without a Summer" in 1816, during which widespread crop failures, frost events in June and July across the northeastern United States and western Europe, and famine affected millions.6, 7
Historical case studies
Several landmark eruptions have shaped both the scientific understanding of volcanic hazards and the development of monitoring and warning systems.
The eruption of Vesuvius in 79 CE is the earliest volcanic disaster described by an eyewitness in sufficient detail to reconstruct the eruptive sequence. The Roman writer Pliny the Younger, observing from Misenum across the Bay of Naples, recorded a towering eruption column, darkness from ashfall, ground tremors, and surges of hot material descending the volcano's flanks. Modern volcanological reconstruction of the deposit stratigraphy has established that the eruption began with a Plinian phase that produced a sustained column 15 to 30 kilometres high, raining white pumice on Pompeii for roughly seven hours. This was followed by at least six pyroclastic surges of progressively greater extent, the fourth of which reached and destroyed Pompeii at approximately 7 a.m. on 25 August.3 The first surge had already overwhelmed Herculaneum, killing all who remained. The total death toll is estimated in the thousands, though precise figures are unknown.
The 1883 eruption of Krakatau was one of the largest volcanic events of the modern era (VEI 6). The paroxysmal phase on 26–27 August 1883 involved a series of four enormous explosions audible up to 4,800 kilometres away, the largest of which is considered the loudest sound in recorded history. The eruption column reached over 25 kilometres altitude, and pyroclastic flows raced across the surface of the Sunda Strait for distances exceeding 40 kilometres. The collapse of the volcanic edifice generated tsunamis that devastated coastal communities on Java and Sumatra, with total fatalities estimated at approximately 36,000.20, 21 Fine ash from Krakatau circled the globe multiple times, producing vivid red sunsets observed worldwide for months and reducing global temperatures by an estimated 0.3 degrees Celsius.6
The 18 May 1980 eruption of Mount St. Helens in Washington State (VEI 5) fundamentally transformed the science of volcano monitoring. A magnitude 5.1 earthquake triggered the collapse of the volcano's unstable north flank in the largest landslide ever recorded, unroofing a cryptodome of pressurised magma that exploded laterally in a devastating directed blast. The blast zone extended approximately 30 kilometres from the vent, flattening mature forest across 600 square kilometres. The eruption killed 57 people and demonstrated the destructive potential of lateral blasts, debris avalanches, and lahars, hazards that had previously received far less attention than Plinian column collapse.4 The event spurred the creation of the USGS Volcano Disaster Assistance Program and the modernisation of volcano monitoring networks in the United States and internationally.23
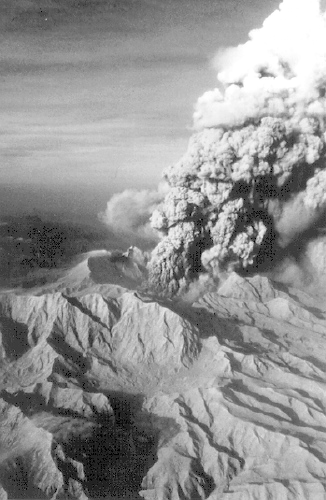
The 1991 eruption of Mount Pinatubo in the Philippines (VEI 6) is widely regarded as the most successful example of eruption forecasting and evacuation in history. Seismic and gas-emission monitoring by a joint team from the Philippine Institute of Volcanology and Seismology (PHIVOLCS) and the USGS Volcano Disaster Assistance Program detected escalating unrest in the weeks before the climactic eruption. Progressive increases in seismicity, ground deformation, and SO2 flux provided the basis for timely evacuation of tens of thousands of people from the danger zone, along with the relocation of personnel and aircraft from Clark Air Base. Despite the enormous scale of the eruption, which ejected approximately 10 cubic kilometres of material, the death toll was approximately 300 — overwhelmingly from lahar-related roof collapses — far fewer than the tens of thousands that would have perished without warning.5, 9, 23
The 2010 eruption of Eyjafjallajökull in Iceland was notable not for its size but for its disproportionate societal impact. The eruption was a relatively modest VEI 4 event, but phreatomagmatic interaction between magma and glacial meltwater produced unusually fine-grained ash that was lofted into the upper troposphere and carried by prevailing winds over densely trafficked North Atlantic and European airspace.13 The week-long closure of European airspace demonstrated that volcanic hazards extend far beyond the immediate vicinity of the volcano and that even moderate eruptions can produce cascading economic consequences in an interconnected global society.
Monitoring techniques
Modern volcano monitoring employs a complementary suite of geophysical and geochemical techniques designed to detect the signals of magma movement, pressurisation, and degassing that typically precede eruptions. No single technique is sufficient in isolation; robust eruption forecasting depends on the integration of multiple data streams.9, 10
Seismology remains the backbone of volcano surveillance. Seismic networks composed of short-period and broadband seismometers detect the earthquakes and tremor signals generated by the movement and pressurisation of magma and hydrothermal fluids within the volcanic edifice. Characteristic seismic signatures include volcano-tectonic (VT) earthquakes caused by brittle fracture of rock as magma forces open new pathways, long-period (LP) events associated with fluid movement through cracks and conduits, and volcanic tremor, a continuous low-frequency signal often observed during magma ascent and eruption. Progressive increases in the rate, magnitude, and shallow depth of VT earthquakes have been among the most reliable precursors of eruptions at well-monitored volcanoes.9
Ground deformation measurements detect the inflation and deflation of the volcanic edifice caused by the accumulation or withdrawal of magma at depth. Traditional techniques include electronic tiltmeters and precise levelling surveys, but the field has been transformed by the Global Positioning System (GPS) and Interferometric Synthetic Aperture Radar (InSAR). Continuous GPS stations can measure three-dimensional displacements of the ground surface with millimetre-level precision at intervals of seconds to minutes, providing real-time detection of magmatic intrusion.10 InSAR uses radar images acquired by orbiting satellites to measure ground surface displacement over broad areas with centimetre-level accuracy. By comparing radar images taken at different times, InSAR can produce spatially continuous maps of deformation that reveal the geometry and depth of subsurface magma bodies. The number of volcanoes at which deformation has been detected by satellite radar has increased from 44 in 1997 to over 220 by 2016, fundamentally expanding the scope of global volcano surveillance.11
Gas emission monitoring provides direct information about the state of the magmatic system. As magma ascends toward the surface, dissolved volatiles exsolve and escape through the volcanic edifice, producing measurable changes in the flux and composition of gases emitted at the summit and flanks. SO2 flux is the most widely measured volcanic gas parameter because it is both volcanologically diagnostic and readily detectable by remote sensing. Ground-based ultraviolet spectrometers using differential optical absorption spectroscopy (DOAS) can measure SO2 column amounts in the volcanic plume, while satellite sensors such as the Ozone Monitoring Instrument (OMI) provide global coverage of volcanic SO2 emissions.12, 22 Increasing SO2 flux often indicates the ascent of fresh, gas-rich magma toward the surface and was a key precursor at Pinatubo in 1991, where SO2 emission rates increased from roughly 500 to over 5,000 tonnes per day in the weeks before the climactic eruption.9, 22
Thermal monitoring and satellite remote sensing complete the modern monitoring toolkit. Infrared sensors on satellites such as MODIS and the VIIRS instrument detect thermal anomalies at volcanic craters, lava domes, and lava flows, providing early warning of eruptive activity at remote or poorly instrumented volcanoes. Systems such as MIROVA (Middle InfraRed Observation of Volcanic Activity) provide automated, near-real-time detection of thermal anomalies at volcanoes worldwide. Combined with InSAR deformation measurements and satellite SO2 observations, these satellite-based systems have made it possible for the first time to monitor every subaerial volcano on Earth from space, albeit at lower temporal resolution than ground-based networks.11, 12
Eruption forecasting and alert systems
Eruption forecasting is the process of assessing the likelihood, timing, and character of a future eruption based on the observable precursory signals of volcanic unrest. Volcanic unrest is defined as any deviation from the baseline behaviour of a volcano — including increased seismicity, ground deformation, gas emissions, or thermal anomalies — that may indicate the movement of magma toward the surface.9 Not all episodes of volcanic unrest culminate in eruption; many intrusions of magma stall at depth without reaching the surface. Distinguishing between unrest that will lead to eruption and unrest that will subside is one of the most difficult challenges in volcanology.
Forecasting relies on the recognition of patterns in precursory data that have been associated with eruptions at the same or analogous volcanoes. The conceptual model of escalating precursors envisions a sequence in which deep seismicity is followed by shallow seismicity, ground inflation, increasing gas emissions, and ultimately phreatic (steam-driven) or magmatic eruptions. In practice, this idealised sequence is often incomplete, non-linear, or complicated by simultaneous signals from multiple processes.9 Probabilistic approaches to eruption forecasting, including Bayesian event trees and statistical failure-forecast models, have been developed to handle the inherent uncertainty, but the skill of forecasting remains strongly dependent on the density and quality of the monitoring data available and on the historical record of the volcano in question.
Volcanic alert level systems provide the operational framework for communicating the status of volcanic unrest and eruption likelihood to civil authorities and the public. The USGS employs a four-tier system — Normal, Advisory, Watch, and Warning — supplemented by aviation colour codes (green, yellow, orange, red) that communicate ash hazards to the aviation sector. Analogous systems operate in Japan, New Zealand, Indonesia, Italy, and other volcanically active countries, though the specific number of levels and the criteria for escalation vary among national agencies.24 Effective crisis communication requires not only accurate scientific assessment but also clear, pre-established protocols for translating monitoring data into actionable warnings, a lesson driven home by the Nevado del Ruiz disaster, in which adequate scientific warnings existed but failed to trigger timely evacuation.8, 24
Supervolcano risk
At the extreme end of the eruption magnitude spectrum lie supervolcanic eruptions, defined as events producing more than 1015 kilograms of ejecta (VEI 8 or greater), roughly 150 times the mass of the 1991 Pinatubo eruption.16

The most recent VEI 8 eruption was the Toba eruption on the island of Sumatra approximately 74,000 years ago. Toba ejected an estimated 2,800 cubic kilometres of dense-rock-equivalent material, forming a caldera 100 by 30 kilometres in extent — now occupied by Lake Toba, the world's largest volcanic lake. The eruption is estimated to have injected roughly 1015 grams of fine ash and a comparable mass of SO2 into the stratosphere, sufficient to produce a volcanic winter with hemispheric cooling of 3 to 5 degrees Celsius or more lasting several years and potentially accelerating the glacial advance that was already underway at the Marine Isotope Stage 5–4 transition.14 Whether Toba caused a severe bottleneck in the human population, as proposed by Ambrose and Rampino, remains debated; archaeological evidence from Africa suggests that at least some human populations persisted through the event without catastrophic disruption, though the extent of regional impacts remains under investigation.7, 14
The Yellowstone volcanic system in the western United States is perhaps the most widely discussed modern supervolcano risk. The Yellowstone hotspot has produced three caldera-forming eruptions in the past 2.1 million years: the Huckleberry Ridge Tuff at 2.1 million years ago (approximately 2,500 cubic kilometres), the Mesa Falls Tuff at 1.3 million years ago (approximately 280 cubic kilometres), and the Lava Creek Tuff at 640,000 years ago (approximately 1,000 cubic kilometres).15 Based on these three events, the annualised probability of another caldera-forming eruption has been estimated at roughly 1 in 730,000, making Yellowstone far more likely to produce hydrothermal explosions, earthquakes, or modest lava flows than a VEI 8 event in any human-relevant timeframe.15, 19 The Yellowstone Volcano Observatory, operated by the USGS, the University of Utah, and other partners, maintains a comprehensive seismic, geodetic, and geochemical monitoring network to detect any change in the system's behaviour.
Global volcano monitoring networks
Coordinated volcano monitoring at the global scale is accomplished through a network of national volcano observatories, international assistance programs, and data-sharing institutions. The USGS Volcano Hazards Program operates five volcano observatories within the United States — the Alaska Volcano Observatory, the Cascades Volcano Observatory, the Hawaiian Volcano Observatory, the Yellowstone Volcano Observatory, and the California Volcano Observatory — and maintains monitoring networks at the 161 potentially active volcanoes identified in the National Volcanic Threat Assessment, of which 18 are classified as very high threat.19
The Volcano Disaster Assistance Program (VDAP), a joint initiative of the USGS and the U.S. Agency for International Development (USAID), was established in 1986 in the aftermath of the Nevado del Ruiz disaster. VDAP deploys portable monitoring equipment and volcanologists to assist countries facing volcanic crises and between crises conducts capacity-building projects, helping to establish and sustain volcano observatories and monitoring programs in more than a dozen countries, with major projects in Central and South America, Indonesia, and Papua New Guinea.23 VDAP played a critical role in the successful monitoring and evacuation during the 1991 Pinatubo crisis and has since responded to volcanic emergencies across the globe.
The Smithsonian Institution's Global Volcanism Program (GVP), based at the National Museum of Natural History in Washington, D.C., maintains the most comprehensive global database of Holocene volcanic activity. The GVP catalogue documents approximately 1,500 volcanoes that have erupted in the past 12,000 years and compiles eruption data, monitoring reports, and bibliographic references that serve as a foundational resource for hazard assessment and research.17 The weekly Smithsonian/USGS Weekly Volcanic Activity Report provides synoptic updates on volcanic activity worldwide, aggregating information from national observatories and satellite data into a publicly accessible digest.
Despite substantial progress in monitoring capability over the past four decades, significant gaps remain. Many of the world's most dangerous volcanoes, particularly in developing countries in Southeast Asia, Central America, and East Africa, lack the dense, multi-parameter monitoring networks necessary for reliable eruption forecasting. The 2018 USGS volcanic threat assessment identified the need for substantial investment in upgrading monitoring infrastructure even within the United States, noting that most high-threat volcanoes require additional seismic, geodetic, and gas-monitoring stations to meet recommended capabilities.19 Expanding satellite-based monitoring through InSAR, thermal, and SO2 sensors offers the most promising path toward global coverage, but ground-based networks remain essential for the high-temporal-resolution data needed for short-term eruption forecasting at individual volcanoes.9, 11, 12
References
The volcanic explosivity index (VEI): an estimate of explosive magnitude for historical volcanism
The eruption of Vesuvius in A.D. 79: reconstruction from historical and volcanological evidence
Perturbation and melting of snow and ice by the 13 November 1985 eruption of Nevado del Ruiz, Colombia, and consequent mobilization, flow and deposition of lahars
A comprehensive approach to monitoring volcano deformation as a window on the eruption cycle
Ash generation and distribution from the April–May 2010 eruption of Eyjafjallajökull, Iceland
The Quaternary and Pliocene Yellowstone Plateau volcanic field of Wyoming, Idaho, and Montana
Volcanic fatalities database: analysis of volcanic threat with distance and victim classification
Tsunami generation by rapid entrance of pyroclastic flow into the sea during the 1883 Krakatau eruption, Indonesia
The Volcano Disaster Assistance Program: helping to save lives worldwide for more than 30 years
Volcano alert level systems: managing the challenges of effective volcanic crisis communication