Overview
- Redshift is the stretching of electromagnetic radiation to longer wavelengths, arising from relative motion (Doppler effect), the expansion of space (cosmological redshift), or gravitational fields (gravitational redshift) — each mechanism described by distinct physics but producing observationally similar spectral shifts.
- Edwin Hubble's 1929 discovery that galaxies recede at velocities proportional to their distances, inferred from their redshifts, established the expansion of the universe and remains the empirical foundation for modern cosmology.
- Redshift serves as both a distance proxy and a lookback-time coordinate: the most distant known objects have redshifts exceeding z = 10, and the cosmic microwave background arrives at z ≈ 1,100, meaning its photons have been stretched by a factor of over a thousand since they were emitted.
Redshift is the phenomenon in which electromagnetic radiation emitted by a source is observed at longer wavelengths than it was originally produced. The term derives from the visible spectrum, where a shift toward longer wavelengths moves light toward the red end, though the effect applies across all wavelengths from radio waves to gamma rays. In astronomy and cosmology, redshift is one of the most fundamental observational quantities, serving simultaneously as a measure of recession velocity, a proxy for distance, and a coordinate for lookback time into the history of the universe. Three distinct physical mechanisms produce redshift: the Doppler effect from relative motion, the stretching of space itself during cosmic expansion, and the climbing of photons out of gravitational potential wells. Each arises from different physics, but all manifest as a systematic displacement of spectral lines toward longer wavelengths.
The redshift parameter z is defined as the fractional change in wavelength: z = (λobserved − λemitted) / λemitted. A redshift of z = 1 means that the observed wavelength is twice the emitted wavelength; the photon's wavelength has been stretched by a factor of (1 + z). This dimensionless number is directly measurable from the positions of spectral lines — the characteristic absorption or emission features produced by atoms and ions at specific, laboratory-determined wavelengths. When these spectral fingerprints appear shifted uniformly toward longer wavelengths, the source is redshifted; when shifted toward shorter wavelengths, it is blueshifted.17
The Doppler effect
The most intuitive form of redshift is the Doppler effect, the same phenomenon that causes the pitch of an ambulance siren to drop as it recedes. When a light source moves away from an observer, each successive wavecrest is emitted from a slightly greater distance, stretching the wavelength and producing a redshift. Conversely, when a source approaches, the wavelengths are compressed, producing a blueshift. For velocities much smaller than the speed of light, the Doppler redshift is well approximated by z ≈ v/c, where v is the recession velocity and c is the speed of light. For velocities that are a significant fraction of c, the relativistic Doppler formula must be used, which accounts for time dilation and ensures that no observed redshift implies a source velocity exceeding the speed of light in special relativity.17
The Doppler effect operates in local, gravitationally bound systems. The rotation curves of galaxies, the orbital motions of binary stars, and the radial velocities of nearby stars in the Milky Way are all measured through Doppler shifts of spectral lines. In these contexts, the interpretation is straightforward: redshift and blueshift reflect the component of velocity along the line of sight. The Andromeda Galaxy, for instance, exhibits a blueshift of approximately z = −0.001 because it is approaching the Milky Way at roughly 300 km/s under their mutual gravitational attraction, overcoming the general expansion of the universe at their relatively close separation of 2.5 million light-years.20
Peculiar velocities — the motions of galaxies relative to the smooth Hubble flow — also produce Doppler redshifts and blueshifts that are superimposed on the cosmological redshift. In nearby galaxy clusters, where peculiar velocities of several hundred to a thousand kilometres per second are common, these motions can be comparable in magnitude to the cosmological redshift itself, introducing scatter into the Hubble diagram. At greater distances, the cosmological component dominates and peculiar velocities become a small perturbation, but their statistical effects remain detectable and must be accounted for in precision cosmological analyses.
Cosmological redshift
On scales much larger than individual galaxy clusters, redshift is dominated not by the peculiar motions of objects through space but by the expansion of space itself. In an expanding universe described by general relativity, the metric of space — the mathematical description of distances — changes with time. As the universe expands, photons traveling through it have their wavelengths stretched in proportion to the scale factor of the expansion. This cosmological redshift is not a Doppler effect in the traditional sense; the galaxy is not moving through space away from us at a velocity that can be straightforwardly interpreted in special relativity. Rather, the space between the galaxy and the observer has expanded during the photon's journey, stretching the wavelength.17
The distinction between Doppler and cosmological redshift is more than semantic. At low redshifts (z ≪ 1), the two descriptions are numerically equivalent, and the velocity-distance interpretation works well. At high redshifts, however, the naive Doppler interpretation breaks down. A galaxy observed at z = 3, for example, would require a recession velocity of three times the speed of light under the non-relativistic Doppler formula — a physically meaningless result. In the correct general-relativistic framework, the expansion of space can cause the distance between two points to increase faster than light without violating special relativity, because no local velocity exceeds c. The redshift in this regime is properly understood as the cumulative stretching of the photon wavelength by the scale factor over the photon's entire travel time.17
The relationship between cosmological redshift and the scale factor a(t) of the universe is exact: 1 + z = a(t0) / a(temit), where t0 is the present time and temit is the time at which the light was emitted. If we observe a galaxy at z = 2, the universe was one-third its current size when the light left that galaxy. This relationship is model-independent: it follows directly from the metric of an expanding spacetime and does not depend on the particular composition of the universe or the equation of state of dark energy.17
Hubble's discovery and the expanding universe
The observational story of cosmological redshift begins with Vesto Slipher, an astronomer at Lowell Observatory who between 1912 and 1917 measured the radial velocities of dozens of spiral nebulae — objects whose nature as galaxies external to the Milky Way had not yet been established. Slipher found that the vast majority were receding from us, with velocities up to 1,100 km/s, far greater than any speeds observed for stars within the Milky Way.1 These measurements were among the earliest hints that the nebulae were extragalactic objects and that the universe might be in a state of general expansion.
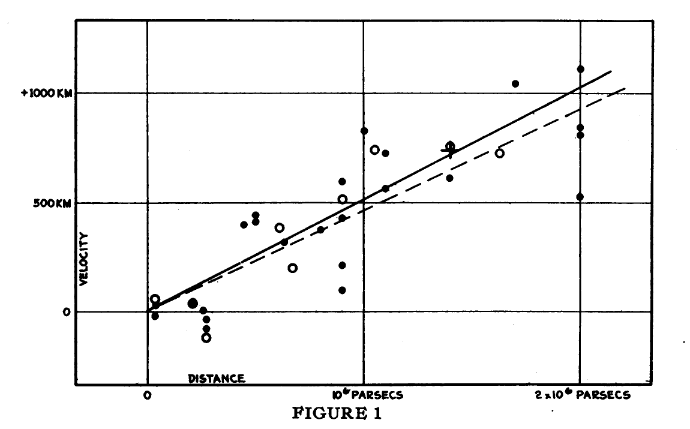
The breakthrough came in 1929, when Edwin Hubble combined Slipher's redshift measurements with his own distance estimates, obtained using Cepheid variable stars as standard candles, and demonstrated a roughly linear relationship between a galaxy's recession velocity and its distance.2 This velocity-distance relation — now known as Hubble's law and the expanding universe — was the first empirical evidence that the universe is expanding. Georges Lemaître had independently derived this relationship from general relativity two years earlier, in a 1927 paper that also estimated a proportionality constant from observational data, though his work received little attention at the time.22
Hubble and Milton Humason extended the velocity-distance relation to greater distances in 1931, using galaxies with recession velocities up to 20,000 km/s, and found that the linear relationship held.3 The proportionality constant in the relationship, v = H0d, is the Hubble constant, which quantifies the present-day rate of expansion. Modern measurements of H0 from the cosmic microwave background yield approximately 67.4 km/s/Mpc, while direct measurements using the cosmic distance ladder return approximately 73 km/s/Mpc — a persistent discrepancy known as the Hubble tension.7, 21
The expansion of the universe, first revealed through the redshifts of galaxies, leads directly to the Big Bang model: if the universe is expanding now, it must have been smaller, denser, and hotter in the past, converging to an initial singularity approximately 13.8 billion years ago.7
Redshift as a distance proxy
Because of the systematic relationship between redshift and distance in an expanding universe, astronomers routinely use redshift as a shorthand for distance and lookback time. At low redshifts, where the Hubble law is linear, converting redshift to distance requires only the Hubble constant: d ≈ cz / H0. At higher redshifts, the relationship depends on the cosmological model — specifically, the densities of matter, radiation, and dark energy, and the spatial curvature of the universe. In the standard ΛCDM cosmology, there is no single "distance" to an object at a given redshift; different physical questions require different distance measures, including luminosity distance (relevant for comparing observed and intrinsic brightness), angular diameter distance (relevant for relating physical and angular sizes), and comoving distance (relevant for computing volumes).17
Despite these subtleties, redshift has become the de facto coordinate system for extragalactic astronomy. Astronomers describe the epoch when the first galaxies formed as "the z > 6 universe," the era of peak star formation as "cosmic noon at z ≈ 2," and the nearby universe as "z ≈ 0." This language reflects the practical reality that redshift is usually the first quantity measured for a distant object — from a single spectrum — while converting it to a physical distance requires adopting a cosmological model and its associated parameters.18
Gravitational redshift
The third mechanism for redshift is gravitational: photons climbing out of a gravitational potential well lose energy, and because a photon's energy is inversely proportional to its wavelength, the loss of energy corresponds to an increase in wavelength — a redshift. This effect was predicted by Einstein's general theory of relativity and is a direct consequence of the equivalence principle. Near a spherically symmetric mass described by the Schwarzschild metric, the gravitational redshift of a photon emitted at radial coordinate r from a mass M is given by 1 + z = (1 − 2GM/rc2)−1/2, where G is Newton's gravitational constant.4
Gravitational redshift was first observationally confirmed in 1925 by Walter Adams, who measured the spectral lines of the white dwarf Sirius B and found them shifted toward the red by an amount consistent with the star's intense surface gravity.5 A far more precise terrestrial verification came in 1960, when Robert Pound and Glen Rebka measured the gravitational redshift of gamma-ray photons traveling vertically through a 22.5-metre tower at Harvard University. Using the Mössbauer effect to achieve the extraordinary frequency resolution required, they confirmed Einstein's prediction to within 10%, providing one of the earliest precision tests of general relativity in a laboratory setting.14
The effect is small for most astronomical objects — a few parts per million for the Sun, a few parts per ten thousand for white dwarfs — but becomes dramatic near compact objects such as neutron stars and black holes, where the gravitational potential is extreme. At the event horizon of a Schwarzschild black hole, the gravitational redshift diverges to infinity, meaning that photons emitted from arbitrarily close to the horizon are stretched to arbitrarily long wavelengths and effectively cannot escape.
In cosmological contexts, gravitational redshift is generally a minor correction compared to cosmological redshift. However, it plays a role in the integrated Sachs-Wolfe effect, which produces secondary temperature anisotropies in the cosmic microwave background as CMB photons pass through time-varying gravitational potentials associated with large-scale structure. The gravitational redshift and blueshift experienced by photons entering and exiting a potential well do not exactly cancel when the well is evolving with time, leaving a net shift that is detectable statistically in CMB maps.7
Redshift surveys and large-scale structure
The systematic measurement of galaxy redshifts on a large scale has been one of the most productive enterprises in observational cosmology. By measuring redshifts for tens of thousands to millions of galaxies, astronomers construct three-dimensional maps of the universe that reveal its large-scale structure — the cosmic web of filaments, walls, voids, and clusters that constitutes the distribution of matter on the largest observable scales.11
The first large-scale redshift survey to reveal the cosmic web in detail was the Center for Astrophysics (CfA) Redshift Survey in the 1980s, which mapped thousands of galaxies and discovered that they are distributed not randomly but in a foam-like pattern of thin walls and filaments surrounding vast, nearly empty voids. The CfA survey revealed striking features such as the "Great Wall," a sheet-like concentration of galaxies stretching across hundreds of millions of light-years, and enormous voids — regions tens of megaparsecs across containing almost no bright galaxies. These structures were wholly unexpected and demonstrated that gravity had organized matter into a complex hierarchical web far richer than simple clustering models had predicted.
Subsequent surveys dramatically expanded this picture. The Two-degree-Field Galaxy Redshift Survey (2dFGRS) measured redshifts for over 220,000 galaxies, covering a volume large enough to detect the characteristic statistical signature of baryon acoustic oscillations in the galaxy distribution.13 The Sloan Digital Sky Survey (SDSS), beginning in 2000 and continuing through multiple phases, produced spectroscopic redshifts for over three million galaxies and quasars, creating the most detailed three-dimensional map of the universe yet assembled.11
These surveys serve a dual purpose. First, they map the distribution and clustering of matter, testing theories of galaxy formation and structure growth. Second, they provide cosmological constraints through the detection of baryon acoustic oscillations — a characteristic scale of approximately 150 megaparsecs imprinted on the galaxy distribution by sound waves in the pre-recombination plasma, the same physics that produces the acoustic peaks in the cosmic microwave background.12 The baryon acoustic oscillation scale serves as a standard ruler: by measuring the apparent size of this feature at different redshifts, astronomers can reconstruct the expansion history of the universe and constrain the properties of dark energy. The most recent major contribution to this program is the Dark Energy Spectroscopic Instrument (DESI), whose 2024 baryon acoustic oscillation results from over six million extragalactic redshifts have provided the most precise measurements of cosmic expansion history to date, with intriguing hints that dark energy may be evolving with time rather than remaining constant.23
High-redshift objects
The quest to observe objects at the highest possible redshifts is equivalent to looking back to the earliest epochs of the universe. Each increment in redshift corresponds to a greater lookback time and a younger cosmic age, pushing observations closer to the formation of the first stars and galaxies. For decades, quasars — the extremely luminous cores of galaxies powered by supermassive black holes accreting matter — held the record for the most distant known objects. The Lyman-break technique, which exploits the absorption of ultraviolet light by neutral hydrogen along the line of sight, enabled the systematic identification of galaxies at redshifts of z = 3 and beyond beginning in the mid-1990s.8
.jpg)
The record for the most distant known quasar has been pushed steadily higher. In 2021, the discovery of quasar J0313−1806 at z = 7.642 demonstrated that supermassive black holes with masses exceeding a billion solar masses already existed when the universe was only 670 million years old — a finding that places stringent constraints on models of black hole formation and growth in the early universe.15
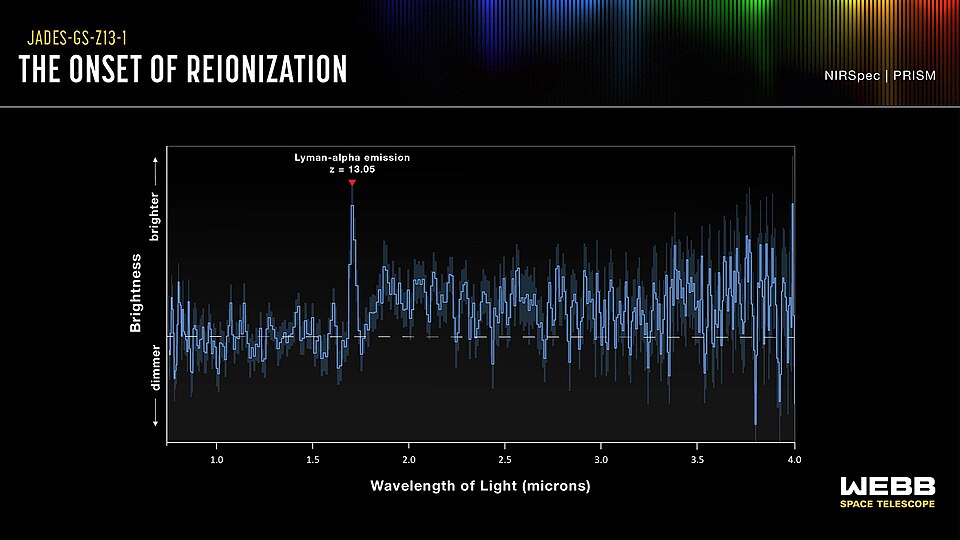
The James Webb Space Telescope (JWST), launched in December 2021, has extended the frontier of high-redshift observations dramatically. JWST's infrared sensitivity is critical because ultraviolet and visible light emitted by the earliest galaxies has been redshifted into the near-infrared and mid-infrared by the expansion of the universe. Among its early results, JWST spectroscopically confirmed GN-z11 at z = 10.6, revealing a compact but remarkably luminous galaxy with an unexpectedly high nitrogen abundance, seen as it existed when the universe was only 430 million years old.16 These high-redshift observations probe the epoch of reionization — the period during which the first luminous sources ionized the neutral hydrogen that had pervaded the intergalactic medium since recombination — and are reshaping understanding of how quickly structure formed after the Big Bang.
The redshift of the cosmic microwave background
The most extreme cosmological redshift observed is that of the cosmic microwave background (CMB). The CMB consists of photons released during recombination — the epoch approximately 380,000 years after the Big Bang when the universe cooled enough for electrons and protons to combine into neutral hydrogen, allowing photons to stream freely for the first time. At the moment of their release, these photons had a temperature of approximately 3,000 kelvin, corresponding to optical and near-infrared wavelengths. Today, they are observed as microwave radiation with a temperature of 2.7255 kelvin, having been redshifted by a factor of approximately 1,100.6, 19
The redshift of the CMB, z ≈ 1,100, means that the universe has expanded by a factor of roughly 1,100 since the epoch of recombination. This single number encapsulates an enormous amount of physical content: it sets the scale of the observable universe, determines the angular scale of features in the CMB sky, and provides the baseline against which all subsequent cosmic expansion is measured. The precision measurement of the CMB temperature and its anisotropies by the COBE, WMAP, and Planck satellites has yielded the most precise determination of cosmological parameters, including the age of the universe (13.8 billion years), its geometry (spatially flat), and its composition (approximately 5% ordinary matter, 27% dark matter, and 68% dark energy).7
Between the CMB at z ≈ 1,100 and the most distant galaxies and quasars observed at z ≈ 10–14 lies a period often called the cosmic dark ages — an era before the first stars and galaxies ignited, when the universe was filled with neutral hydrogen and no luminous sources existed. This gap in the observable redshift record represents one of the last unexplored frontiers in observational cosmology, with 21-centimetre hydrogen line experiments such as HERA and the Square Kilometre Array designed to probe it.
The CMB redshift also provides a powerful consistency check on the standard cosmological model. The temperature of the CMB at any earlier epoch should scale as T(z) = T0(1 + z), where T0 = 2.7255 K is the present-day temperature.19 This prediction has been tested independently by observing the thermal Sunyaev-Zel'dovich effect in galaxy clusters at various redshifts and by measuring the excitation of interstellar molecules in high-redshift absorbers, both of which confirm that the CMB temperature increases with redshift as expected in a universe that has been cooling by adiabatic expansion.
Redshift and the expansion history of the universe
The relationship between redshift and distance is not fixed but depends on the expansion history of the universe, which in turn depends on its matter-energy content. This dependence makes redshift observations a powerful tool for distinguishing between cosmological models. In a universe dominated by matter, the expansion decelerates over time, and the redshift-distance relation curves in a specific way. In a universe with a cosmological constant or dark energy, the expansion eventually accelerates, altering the redshift-distance relation at moderate to high redshifts.
The most dramatic application of this principle came in 1998, when two independent teams — the Supernova Cosmology Project and the High-z Supernova Search Team — used Type Ia supernovae as standardizable candles to measure the redshift-distance relation out to z ≈ 1. They found that distant supernovae were fainter than expected in a decelerating universe, implying that the expansion of the universe is accelerating rather than slowing down under the gravitational pull of its matter content. This discovery of the accelerating expansion of the universe, attributed to dark energy, was awarded the 2011 Nobel Prize in Physics.9, 10
The supernova result illustrates a broader principle: the redshift-distance relation encodes the entire dynamical history of cosmic expansion. At low redshifts, all viable cosmological models predict nearly identical relationships. The models diverge at higher redshifts, where the effects of deceleration (from matter) and acceleration (from dark energy) accumulate over longer photon travel times. By populating the redshift-distance diagram with standardizable objects across a wide range of redshifts, astronomers can reconstruct the expansion rate as a function of cosmic time and thereby determine when deceleration gave way to acceleration — a transition that occurred at approximately z ≈ 0.7, or roughly six billion years ago.9
The redshift-distance relation, refined by increasingly precise observations of supernovae, baryon acoustic oscillations, and the cosmic microwave background, now constrains the expansion history of the universe from z ≈ 1,100 to the present day. The concordance between these independent probes — each relying on different physics and different systematic uncertainties — provides the empirical foundation for the standard ΛCDM model and its conclusion that the universe is spatially flat, composed predominantly of dark energy and dark matter, and approximately 13.8 billion years old.7, 12, 23
References
On the displacement of spectral lines towards the red in the spectra of white dwarf stars
Observational evidence from supernovae for an accelerating universe and a cosmological constant
Detection of the baryon acoustic peak in the large-scale correlation function of SDSS luminous red galaxies
JADES NIRSpec spectroscopy of GN-z11: exceptional nitrogen abundance and a super-solar N/O ratio at z = 10.6
Final results from the Hubble Space Telescope Key Project to measure the Hubble constant
A comprehensive measurement of the local value of the Hubble constant with 1 km/s/Mpc uncertainty from the Hubble Space Telescope and the SH0ES team
Un univers homogène de masse constante et de rayon croissant rendant compte de la vitesse radiale des nébuleuses extra-galactiques
DESI 2024 VI: Cosmological constraints from the measurements of baryon acoustic oscillations