Overview
- Spectroscopy, the decomposition of light into its constituent wavelengths, is the principal tool by which astronomers determine the chemical composition, temperature, density, magnetic field strength, and radial velocity of celestial objects, with roots stretching from Newton's 1666 prism experiments through Fraunhofer's cataloguing of solar absorption lines to Kirchhoff and Bunsen's identification of chemical elements by their spectral fingerprints.
- The Harvard spectral classification system (OBAFGKM), refined by Annie Jump Cannon and physically grounded by Meghnad Saha's ionization equation and Cecilia Payne's 1925 thesis, established that stellar spectral differences arise primarily from surface temperature rather than composition, enabling the systematic categorization of stars that underpins the Hertzsprung-Russell diagram and modern stellar astrophysics.
- Doppler spectroscopy has enabled the detection of thousands of exoplanets through stellar radial velocity shifts, while transmission and emission spectroscopy with the James Webb Space Telescope now permit direct characterization of exoplanet atmospheres, and multi-messenger spectroscopy across the electromagnetic spectrum has become indispensable for interpreting transient events such as kilonovae and gamma-ray bursts.
Spectroscopy is the branch of observational astronomy devoted to decomposing electromagnetic radiation into its constituent wavelengths and interpreting the resulting patterns. Because light from a celestial object encodes information about the atoms and molecules it has interacted with, a spectrum serves as a remote laboratory analysis: it reveals chemical composition, surface temperature, density, pressure, magnetic field strength, and radial velocity without requiring physical contact with the source. Virtually every major advance in astrophysics since the mid-nineteenth century—from the identification of hydrogen as the dominant element in stars to the discovery of the accelerating expansion of the universe—has depended on spectroscopic measurement.16
The development of astronomical spectroscopy unfolded across four centuries, beginning with Newton's demonstration that white light is a mixture of colors, passing through Fraunhofer's precise cataloguing of dark lines in the solar spectrum, and reaching maturity with Kirchhoff and Bunsen's realization that each chemical element produces a unique spectral fingerprint. These foundations enabled the classification of stars by spectral type, the measurement of cosmic velocities through the Doppler effect, and the modern characterization of exoplanet atmospheres by space-based observatories. The story of spectroscopy is, in many respects, the story of how astronomers learned to read the light of the universe.3, 16
Newton and the prism
The modern understanding of spectroscopy begins with Isaac Newton's experiments at Trinity College, Cambridge, in 1666. By admitting a narrow beam of sunlight through a hole in a window shutter and passing it through a glass prism, Newton demonstrated that white light is not a simple, homogeneous entity but a composite of rays that refract by different amounts, spreading into a continuous band of colors from red through violet. He termed this band a "spectrum" and conducted a decisive test of his hypothesis: by isolating a single color from the first prism and passing it through a second prism, he showed that the isolated color could not be further decomposed. White light was therefore a mixture, and the prism was merely separating what was already present. Newton published these findings in his Opticks in 1704, establishing the conceptual prerequisite for all subsequent spectroscopic work.1
Newton's spectrum was continuous—an unbroken gradient from one color to the next. He did not have the optical precision to discern fine structure within it. That discovery would require more than a century of advances in glassmaking and instrument design before another investigator could resolve the spectrum into its detailed features.1, 16
Fraunhofer lines
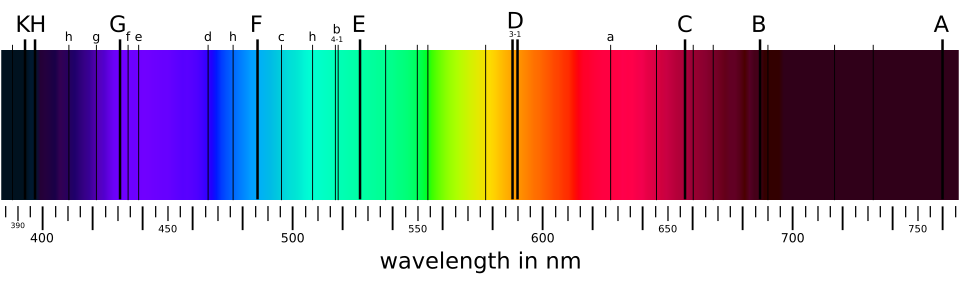
In 1814, the Bavarian optician Joseph von Fraunhofer, while testing prisms for use in achromatic lenses, directed sunlight through a slit and a high-quality prism and observed that the solar spectrum was crossed by hundreds of dark lines at specific, reproducible wavelength positions. Fraunhofer was not the first to notice such lines—the English chemist William Hyde Wollaston had seen a few in 1802—but Fraunhofer mapped them with unprecedented precision, cataloguing over 570 lines and designating the most prominent with the letters A through K, a notation still in use today. His results, published in 1817, transformed the solar spectrum from a simple rainbow into a detailed document awaiting interpretation.2
Fraunhofer also observed stellar spectra by attaching a prism to a telescope, noting that the spectra of bright stars such as Sirius displayed different patterns of dark lines from those in sunlight. This observation implied that the composition or physical state of the light source varied from star to star, though Fraunhofer did not pursue the chemical interpretation. The instrument he developed for this work—the slit spectroscope mounted on a telescope—became the prototype of every astronomical spectrograph that followed.2, 16
Kirchhoff's laws of spectroscopy
The physical explanation of Fraunhofer's lines came in 1859–1860 through the work of the physicist Gustav Kirchhoff and the chemist Robert Bunsen at the University of Heidelberg. Bunsen had recently invented the gas burner that bears his name, which produced a nearly colorless flame ideal for observing the characteristic light emitted by chemical substances introduced into it. By systematically comparing the spectra produced by various chemical elements heated in the Bunsen flame with the dark lines in the solar spectrum, Kirchhoff demonstrated that each element emits light at precisely the same wavelengths at which it absorbs light when a continuous source is viewed through cooler gas containing that element. The dark D lines in the solar spectrum, for example, appeared at exactly the wavelengths of the bright yellow emission lines of sodium. Kirchhoff concluded that the Sun's atmosphere contains sodium, and that Fraunhofer's dark lines arise because cooler gas in the outer layers of the Sun absorbs specific wavelengths from the continuous spectrum produced by the hotter interior.3
From this work, Kirchhoff formulated three empirical laws that remain the foundation of spectroscopic analysis. First, a hot, dense source—whether a solid, liquid, or dense gas—emits a continuous spectrum with no dark or bright lines. Second, a hot, low-density gas emits light only at specific wavelengths characteristic of the chemical elements present, producing a bright-line or emission spectrum. Third, when a continuous spectrum passes through a cooler, low-density gas, the gas absorbs light at the same characteristic wavelengths, producing dark absorption lines superimposed on the continuum. These three spectral types—continuous, emission, and absorption—correspond to three distinct physical situations, and correctly identifying which situation applies to a given astronomical source is the first step in interpreting its spectrum.4, 16
Kirchhoff and Bunsen's method rapidly proved its astronomical power. By the mid-1860s, William Huggins and his collaborator William Allen Miller had used spectroscopy to identify chemical elements in the atmospheres of stars and to demonstrate that nebulae fell into two categories: those with continuous spectra, which were unresolved star clusters, and those with emission-line spectra, which were genuine clouds of luminous gas.17, 18 In 1868, Norman Lockyer and Pierre Janssen independently observed a bright yellow emission line in the spectrum of the solar chromosphere during a total eclipse that did not correspond to any known element. Lockyer attributed it to a new element, which he named helium, from the Greek helios for "sun." Helium was not identified on Earth until 1895, making it the first element discovered by spectroscopy before being found in a terrestrial laboratory.5
Emission and absorption spectra in astrophysics
The distinction between emission and absorption spectra pervades every domain of observational astrophysics. Stars, whose dense photospheres emit continuous blackbody radiation that then passes through their cooler, more rarefied atmospheres, display absorption spectra: a continuous background crossed by dark lines characteristic of the elements present in the stellar atmosphere. The pattern, depth, and width of these absorption lines encode not only the chemical composition of the atmosphere but also its temperature, surface gravity, turbulent velocity, and magnetic field strength. Broadened absorption lines, for instance, can indicate rapid stellar rotation, high surface gravity, or strong magnetic fields through the Zeeman effect.14, 16
Emission spectra, by contrast, arise from hot, low-density gas that is not backed by a brighter continuum source. Planetary nebulae, H II regions surrounding hot young stars, and the gaseous filaments of supernova remnants all display bright emission lines. Because these objects are optically thin—the gas column is tenuous enough that photons escape without being reabsorbed—their spectra consist of discrete bright lines at the characteristic wavelengths of the constituent ions. The relative intensities of these emission lines provide direct measurements of temperature, electron density, and ionic abundances in the gas, enabling astronomers to determine the chemical enrichment produced by nucleosynthesis in successive generations of stars.14, 16
The quantitative analysis of spectral lines extends far beyond simple element identification. The equivalent width of an absorption line—a measure of the total flux it removes from the continuum—is related to the column density of the absorbing species through the curve of growth, a relationship that connects line strength to the number of absorbing atoms along the line of sight. Weak, unsaturated lines grow linearly with column density, while stronger lines flatten as the core saturates and eventually broaden through pressure or velocity effects on the wings. Detailed analysis of these line profiles yields not only elemental abundances but also microturbulent velocities, atmospheric stratification, and isotopic ratios in stellar atmospheres.14, 16
A third spectral regime, common in high-energy astrophysics, is the continuum emission produced by non-thermal processes such as synchrotron radiation from relativistic electrons spiraling in magnetic fields, or bremsstrahlung (free-free emission) from ionized plasma. These continua lack the discrete features of atomic line spectra but carry information about the energy distribution and physical conditions of the emitting region. The spectra of active galactic nuclei, for example, combine broad and narrow emission lines from gas at different distances from the central black hole with a strong non-thermal continuum produced by the accretion disk and relativistic jet.16
Stellar classification: OBAFGKM
The systematic classification of stars by their spectra was one of the great achievements of late nineteenth- and early twentieth-century astronomy. The work was carried out principally at the Harvard College Observatory under the direction of Edward C. Pickering, as part of the Henry Draper Memorial project. A series of women astronomers—Williamina Fleming, Antonia Maury, and most decisively Annie Jump Cannon—examined and classified tens of thousands of stellar spectra recorded on photographic plates.6
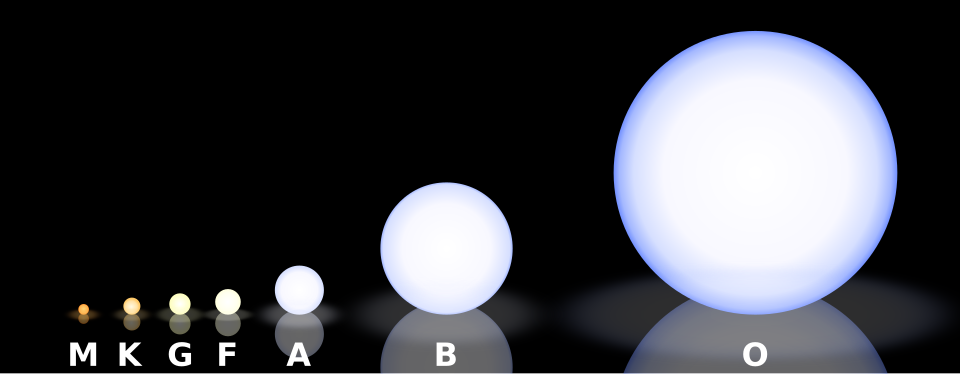
Cannon reorganized the earlier alphabetical classification into the temperature sequence O, B, A, F, G, K, M, with each class subdivided into ten numerical subtypes (0 through 9). She personally classified the spectra of more than 350,000 stars for the Henry Draper Catalogue, published between 1918 and 1924. In 1922, the International Astronomical Union adopted Cannon's system as the standard, and with only minor extensions it remains in use today. The sequence runs from the hottest O-type stars, with surface temperatures exceeding 30,000 kelvins and spectra dominated by ionized helium lines, through the intermediate A-type stars where hydrogen Balmer lines reach maximum strength near 10,000 kelvins, to the coolest M-type stars below 3,700 kelvins whose spectra are dominated by molecular bands of titanium oxide.6, 14
The physical basis for this classification was established by Meghnad Saha's 1920 ionization equation, which relates the ionization state of atoms in a gas to its temperature and electron pressure.7 Saha's equation explained why different spectral types display different absorption lines: it is not that stars of different types have different chemical compositions, but rather that different temperatures cause the same elements to exist in different ionization states and energy levels, producing different patterns of absorption. In 1925, Cecilia Payne applied the Saha equation systematically in her doctoral thesis at Harvard, demonstrating that the enormous variation in stellar spectra along the OBAFGKM sequence could be explained almost entirely by temperature differences while the underlying chemical composition was remarkably uniform—dominated overwhelmingly by hydrogen and helium. Her thesis established that the spectral classification sequence is fundamentally a temperature sequence, a result later described by Otto Struve as "the most brilliant PhD thesis ever written in astronomy."8
The two-dimensional Morgan–Keenan (MK) system, introduced in 1943, added luminosity classes (Roman numerals I through V) to the Harvard spectral types, enabling the distinction between supergiants, giants, subgiants, and main-sequence dwarfs of the same temperature on the basis of pressure-sensitive spectral features such as line width and the ratios of specific line pairs.9 A complete MK classification—for example, G2 V for the Sun or M2 Ia for Betelgeuse—encodes both the surface temperature and the luminosity of the star. This information, combined with the calibrated Hertzsprung–Russell diagram, enables spectroscopic distance estimation: once a star's spectral type and luminosity class are known, its absolute magnitude can be inferred, and comparison with its apparent magnitude yields the distance via the distance modulus. This technique, known as spectroscopic parallax, has been one of the most widely used rungs on the cosmic distance ladder.9, 16
The Doppler effect and radial velocity measurement
In 1842, the Austrian physicist Christian Doppler proposed that the observed frequency of a wave changes when the source and observer are in relative motion: the frequency increases (the wavelength shortens, or blueshifts) when the source approaches, and decreases (the wavelength lengthens, or redshifts) when it recedes. Although Doppler originally discussed the effect in the context of sound and erroneously applied it to explain stellar colors, the underlying principle was correct and was soon confirmed experimentally for sound waves.19
The astronomical application of the Doppler effect became possible once spectroscopy could measure precise wavelength positions of absorption or emission lines. If a star or galaxy is moving toward or away from the observer, its spectral lines are shifted from their laboratory rest wavelengths by an amount proportional to the radial velocity. In 1868, William Huggins made one of the earliest attempts to measure the radial velocity of a star spectroscopically, estimating the velocity of Sirius from the displacement of its hydrogen lines. By the 1870s, Hermann Carl Vogel had refined the technique and begun systematic spectroscopic velocity surveys of bright stars.17, 20
The Doppler shift of spectral lines has proved to be one of the most versatile measurements in all of astronomy. On the largest scales, the systematic redshift of galaxy spectra provided the observational evidence for the expansion of the universe, formalized in Hubble's law. Vesto Slipher's measurements of galaxy redshifts beginning in 1912, combined with Edwin Hubble's distance determinations in 1929, established that the universe is expanding and that more distant galaxies recede faster—a discovery that reshaped cosmology and eventually led to the Big Bang model.16 On stellar scales, periodic Doppler shifts in the spectral lines of binary stars reveal their orbital motions and allow the determination of stellar masses, the most fundamental parameter in stellar evolution. The same principle, applied with extreme precision, enables the detection of unseen planetary companions through the radial velocity method.10
Doppler spectroscopy and exoplanet detection
The radial velocity method of exoplanet detection exploits the fact that a planet does not simply orbit its host star; rather, both the planet and the star orbit their common center of mass. As the star is tugged gravitationally by an orbiting planet, it undergoes a small periodic reflex motion that produces a Doppler shift in its spectral lines. The amplitude of this shift is proportional to the planet's mass and inversely related to the orbital distance, so massive, close-in planets produce the largest and most easily detected signals.10, 16
The technique requires extraordinary spectroscopic precision. A Jupiter-mass planet in a Jupiter-like orbit induces a radial velocity variation of roughly 12 meters per second in a Sun-like star, while an Earth-mass planet in Earth's orbit produces a signal of only about 9 centimeters per second. Modern echelle spectrographs achieve precisions of better than 1 meter per second by using laser frequency combs or iodine absorption cells as wavelength calibration references, enabling the detection of Neptune-mass and super-Earth planets.10, 16
Spectroscopic techniques also played a role in the very first confirmed detection of planets beyond the solar system, though not through the Doppler method. In 1992, Aleksander Wolszczan and Dale Frail identified two Earth-mass planets orbiting the millisecond pulsar PSR 1257+12 by detecting periodic variations in the arrival times of the pulsar's radio pulses—a technique that depends on precise spectral characterization of the pulsed signal and its dispersion through the interstellar medium.11 These pulsar planets, formed in the exotic aftermath of a supernova, were not representative of planetary systems around normal stars, but their discovery demonstrated that planets could be detected indirectly through high-precision analysis of electromagnetic signals and opened an entirely new chapter in planetary science.11
The first confirmed detection of an exoplanet orbiting a Sun-like star was achieved in 1995 by Michel Mayor and Didier Queloz using the radial velocity method. Their spectrographic observations at the Haute-Provence Observatory revealed that the star 51 Pegasi exhibited a periodic velocity variation with a semi-amplitude of about 59 meters per second and a period of only 4.23 days, implying a companion of at least half a Jupiter mass in an orbit far closer to its star than Mercury is to the Sun. This "hot Jupiter" was entirely unexpected by existing planet formation theories and transformed the field of planetary science. Mayor and Queloz received the 2019 Nobel Prize in Physics for this discovery.10 As of 2024, the radial velocity method has confirmed over 1,000 exoplanets and remains one of the two primary detection techniques alongside transit photometry.16
Spectral analysis of exoplanet atmospheres
While the radial velocity method reveals the presence, minimum mass, and orbital parameters of an exoplanet, it provides no direct information about the planet's atmosphere or composition. That information requires a different spectroscopic technique: transmission spectroscopy, in which the spectrum of the host star is observed during a planetary transit, when the planet passes in front of the stellar disk as seen from Earth. During transit, a thin annulus of starlight filters through the planet's atmosphere, and atoms and molecules in that atmosphere absorb light at their characteristic wavelengths. By comparing the transit spectrum with the out-of-transit stellar spectrum, astronomers can identify the absorbing species and infer atmospheric composition, temperature structure, and the presence of clouds or hazes.21
The complementary technique of emission spectroscopy observes the planet's own thermal radiation, typically by measuring the difference in flux when the planet passes behind the star (secondary eclipse) versus when both star and planet are visible. Because the planet's dayside emits thermal infrared radiation shaped by its atmospheric temperature profile and composition, the secondary eclipse depth as a function of wavelength yields an emission spectrum of the planet. Together, transmission and emission spectroscopy provide complementary constraints on atmospheric properties: transmission probes the terminator region (the day-night boundary), while emission probes the dayside.21
The James Webb Space Telescope (JWST), launched in December 2021, has transformed exoplanet atmospheric characterization. Its infrared sensitivity, spectral resolution, and photometric stability far exceed those of previous observatories. In 2022, the JWST Transiting Exoplanet Community Early Release Science program targeted the hot Saturn WASP-39b and produced the first unambiguous detection of carbon dioxide in an exoplanet atmosphere, observed as a prominent absorption feature near 4.3 micrometers in the NIRSpec transmission spectrum.13 Additional analysis of the same target with the NIRSpec PRISM mode identified water vapour, carbon monoxide, sulfur dioxide, and evidence for photochemistry driven by the host star's ultraviolet radiation.12 These detections demonstrated that JWST can measure atmospheric compositions at the level of individual molecular species, opening the prospect of characterizing the atmospheres of smaller, cooler planets in the habitable zones of their host stars.12, 13
Spectroscopy and cosmological distances
Spectroscopy provides some of the most powerful methods for measuring distances to objects beyond the reach of geometric parallax. The redshift of spectral lines in the light of distant galaxies, interpreted as a consequence of the expansion of space, yields a recession velocity that can be converted to a distance through Hubble's law or, at higher redshifts, through the full cosmological distance-redshift relation derived from general relativity. Measuring a galaxy's redshift requires only a moderate-quality spectrum sufficient to identify one or more known spectral features—emission lines of hydrogen, oxygen, or other elements, or the characteristic break in the continuum at the 4000-angstrom calcium H and K absorption lines—and comparing their observed wavelengths with their known rest wavelengths.16
This technique has been applied on an industrial scale. Large spectroscopic surveys such as the Sloan Digital Sky Survey have measured redshifts for millions of galaxies and quasars, mapping the three-dimensional distribution of matter in the universe and revealing the large-scale structure of galaxy clusters, filaments, walls, and voids. The baryon acoustic oscillation signal—a characteristic scale imprinted on the distribution of galaxies by sound waves in the early universe—can be measured from spectroscopic redshift surveys and used as a standard ruler, providing distance measurements that constrain the expansion history and the nature of dark energy.16
At the highest redshifts, spectroscopy identifies the most distant known objects in the universe. The Lyman-alpha emission line of hydrogen, which falls at 1216 angstroms in the rest frame, is shifted into the optical or near-infrared for galaxies at redshifts above about 2, making it a powerful tracer of the earliest generations of galaxies and providing constraints on the epoch of reionization. JWST spectroscopy has confirmed galaxies at redshifts exceeding 13, corresponding to an epoch when the universe was less than 350 million years old—objects whose very existence tests models of star formation and galaxy formation in the early universe.16
Spectroscopy also enables the classification of supernovae by their spectral features, a distinction with profound cosmological consequences. Type Ia supernovae, identified by the absence of hydrogen lines and the presence of a strong silicon absorption feature near 6150 angstroms, serve as standardizable candles whose peak luminosities can be calibrated from their light-curve shapes. Spectroscopic confirmation of supernova type is therefore a prerequisite for using these explosions to measure the expansion history of the universe—the technique that led to the 1998 discovery of the accelerating expansion.16
Multi-messenger and multi-wavelength spectroscopy
Modern astrophysics increasingly relies on spectroscopy performed across the full electromagnetic spectrum, from radio wavelengths to gamma rays, and coordinated with non-electromagnetic messengers such as gravitational waves and neutrinos. This multi-messenger approach was dramatically validated on 17 August 2017, when the LIGO and Virgo gravitational-wave detectors observed the signal GW170817 from a neutron star merger, and within seconds a short gamma-ray burst was detected by the Fermi and INTEGRAL satellites. Over the following days and weeks, telescopes across the electromagnetic spectrum performed spectroscopic observations of the resulting kilonova in the galaxy NGC 4993.15
The optical and near-infrared spectra of the kilonova, obtained by Pian and collaborators among others, revealed broad absorption features attributable to heavy elements synthesized by rapid neutron capture (r-process nucleosynthesis) during and after the merger. These spectral signatures provided the first direct observational confirmation that neutron star mergers are a major production site for elements heavier than iron, including gold, platinum, and uranium. Without spectroscopy, the identification of the r-process products would have been impossible; photometry alone could not have distinguished the kilonova from other transient sources with similar brightness and color evolution.15
Multi-wavelength spectroscopy is equally essential for understanding other classes of transient and variable phenomena. The spectra of gamma-ray burst afterglows at X-ray, optical, and radio wavelengths reveal the composition of the circumburst medium and the geometry of the relativistic outflow. Radio spectroscopy of fast radio bursts measures their dispersion and rotation measures, constraining the electron column density and magnetic field strength along the line of sight through the intergalactic medium. Spectroscopy of the cosmic microwave background confirms its near-perfect blackbody form and constrains the thermal history of the early universe.16
From Newton's prism to the cryogenic detectors aboard the James Webb Space Telescope, the trajectory of astronomical spectroscopy has been one of steadily increasing precision, wavelength coverage, and interpretive power. Each generation of instruments has opened new spectral windows and revealed phenomena invisible to its predecessors. Yet the underlying logic has remained unchanged since Kirchhoff and Bunsen first matched a dark line in the solar spectrum to a bright line in a laboratory flame: matter interacts with radiation in ways that are characteristic, reproducible, and interpretable, and the spectrum is the document in which that interaction is recorded. The continued centrality of spectroscopy to every subfield of modern astrophysics—from stellar evolution and nucleosynthesis to exoplanet science and observational cosmology—confirms that learning to read the light remains the most productive strategy astronomers have ever devised for understanding a universe they cannot touch.4, 16
References
Opticks: or, A Treatise of the Reflexions, Refractions, Inflexions and Colours of Light
Bestimmung des Brechungs- und des Farbenzerstreuungs-Vermögens verschiedener Glasarten, in Bezug auf die Vervollkommnung achromatischer Fernröhre
Ueber das Verhältniss zwischen dem Emissionsvermögen und dem Absorptionsvermögen der Körper für Wärme und Licht
Stellar Atmospheres: A Contribution to the Observational Study of High Temperature in the Reversing Layers of Stars
Speculations on the Constitution of Matter, and on the Condition of the Sun's Envelope